
การวิเคราะห์ข้อมูลนั้นมิใช่เรื่องใหม่หรือเป็นปรากฎการณ์ใหม่ที่เพิ่งเกิดขึ้นในยุคดิจิทัล เพียงแต่ปัจจุบันเรามีข้อมูลมากมายมหาศาล ดังนั้นจึงไม่แปลกที่การวิเคราะห์ข้อมูลในปัจจุบันของหลายหน่วยงาน ไม่ว่าจะเป็นหน่วยงานรัฐหรือหน่วยงานเอกชนได้กลายมาเป็นการวิเคราะห์ข้อมูลจากข้อมูลที่มีขนาดใหญ่ (Big Data)
ในบทความนี้ผู้เขียนอยากแนะนำวิธีทางสถิติและโค้ดในภาษา R และ Python ที่สามารถนำมาใช้วิเคราะห์ความสัมพันธ์กับข้อมูลขนาดใหญ่ (Correlation Analysis in Big Data) ได้ดังนี้
- การหาค่าสัมประสิทธิ์สหสัมพันธ์ (Correlation) ประเภทต่าง ๆ
- การหาค่า Maximal Information Coefficient (MIC)
การหาค่าสัมประสิทธิ์สหสัมพันธ์ (Correlation Coefficient) ประเภทต่าง ๆ
ค่า Pearson Correlation เป็นวิธีทางสถิติที่นิยมนำมาใช้วิเคราะห์เพื่อหาความสัมพันธ์ของข้อมูลมากที่สุดวิธีหนึ่ง เนื่องจากเป็นวิธีที่เข้าใจง่ายและสามารถคำนวนได้ไม่ยาก โดยค่า Pearson Correlation จะมีค่าอยู่ระหว่าง -1.0 ถึง +1.0 ซึ่งหากมีค่าใกล้ -1.0 นั้นหมายความว่าตัวแปรทั้งสองตัวมีความสัมพันธ์กันอย่างมากในเชิงตรงกันข้าม หากมีค่าใกล้ +1.0 นั้นหมายความว่า ตัวแปรทั้งสองมีความสัมพันธ์กันอย่างมากในทิศทางเดียวกัน และหากมีค่าเป็น 0 นั้นหมายความว่า ตัวแปรทั้งสองตัวไม่มีความสัมพันธ์ต่อกัน ทั้งนี้ค่าสัมประสิทธิ์สหสัมพันธ์เป็นการวิเคราะห์ความสัมพันธ์ของข้อมูลในลักษณะแบบเส้นตรงเท่านั้น ดังนั้นค่า Pearson Correlation จึงขาดความน่าเชื่อถือในกรณีที่ข้อมูลที่นำมาวิเคราะห์นั้นมิได้มีลักษณะความสัมพันธ์แบบเส้นตรง (โปรดดูภาพที่ 1 ประกอบ)

ที่มาภาพ: https://en.wikiversity.org/wiki/Survey_research_and_design_in_psychology/Tutorials/Correlation/Correlations_and_non-linear_relations
ค่า Spearman Correlation เป็นการหาความสัมพันธ์ระหว่างตัวแปร 2 ตัวที่อยู่ในมาตราการวัดระดับ Ordinal Scale โดยค่า Spearman Correlation จะมีค่าอยู่ระหว่าง -1.0 ถึง +1.0 เช่นเดียวกับ ค่า Pearson Correlation ส่วนการแปลความหมายก็ไม่ต่างจากการแปลความหมายของค่า Pearson Correlation นั้นคือ หากค่า Spearman Correlation ใกล้ -1.0 นั้นหมายความว่าตัวแปรทั้งสองตัวมีความสัมพันธ์กันอย่างมากในเชิงตรงกันข้าม หากค่า Spearman Correlation ใกล้ +1.0 นั้นหมายความว่า ตัวแปรทั้งสองมีความสัมพันธ์กันอย่างมากในทิศทางเดียวกัน และหากค่า Spearman Correlation เป็น 0 นั้นหมายความว่า ตัวแปรทั้งสองตัวไม่มีความสัมพันธ์ต่อกัน
ค่า Kendall Correlation เป็นการหาความสัมพันธ์ระหว่างตัวแปร 2 ตัวที่อยู่ในมาตราการวัดระดับ Ordinal Scale โดยค่า Kendall Correlation จะมีค่าอยู่ระหว่าง -1.0 ถึง +1.0 เช่นเดียวกับ ค่า Pearson Correlation และ ค่า Spearman Correlation ส่วนการแปลความหมายก็ไม่ต่างจากการแปลความหมายของค่า Pearson Correlation และ ค่า Spearman Correlation นั้นคือ หากค่า Kendall Correlation ใกล้ -1.0 นั้นหมายความว่าตัวแปรทั้งสองตัวมีความสัมพันธ์กันอย่างมากในเชิงตรงกันข้าม หากค่า Kendall Correlation ใกล้ +1.0 นั้นหมายความว่า ตัวแปรทั้งสองมีความสัมพันธ์กันอย่างมากในทิศทางเดียวกัน และหากค่า Kendall Correlation เป็น 0 นั้นหมายความว่า ตัวแปรทั้งสองตัวไม่มีความสัมพันธ์ต่อกัน อย่างไรก็ตาม ค่า Kendall Correlation จะสามารถใช้ในการบ่งบอกถึงระดับความเข้มข้น (strength) ของความสัมพันธ์ระหว่างตัวแปรทั้งสองได้ดีกว่าค่า Pearson Correlation และ ค่า Spearman Correlation[1] ดังนั้นโดยปกติค่า Kendall Correlation จะน้อยกว่า ค่า Pearson Correlation และ ค่า Spearman Correlation เสมอ (โปรดดูภาพที่ 2 ประกอบ)
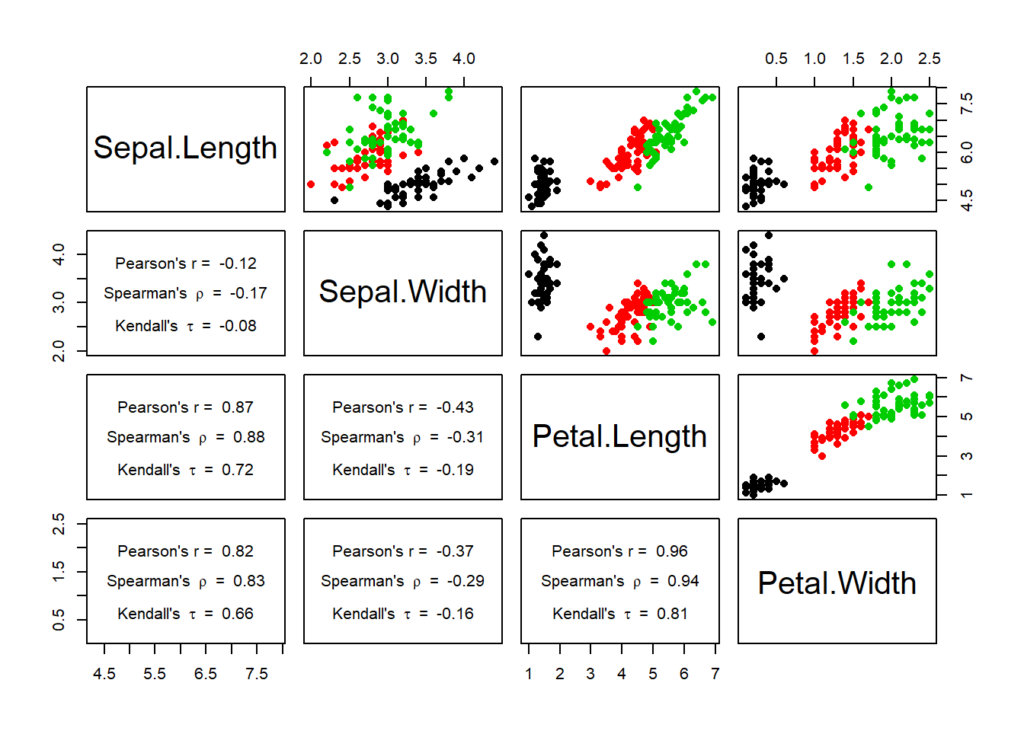
(ที่มาภาพ: http://rstudio-pubs-static.s3.amazonaws.com/377463_0c897b0db2584c888aad81f7c8ac64ab.html)
ข้างล่างเป็นตัวอย่างของโค้ดที่ใช้ในการคำนวณค่าสัมประสิทธิ์สหสัมพันธ์ทั้ง 3 ประเภทในภาษา R และ ภาษา Python
R Code:
 set.seed(1234)
 # 1000 random integers between 0 and 50
 x <- sample(c(0:50), size = 1000, replace = TRUE)
 # Positive Correlation with some noise
 y <- x + rnorm(1000, sd = 10)

 # Various correlations
 cor(x, y, method = c("pearson"))
 cor(x, y, method = c("kendall"))
 cor(x, y, method = c("spearman"))
Python Code:
import numpy as np
from scipy import stats

np.random.seed(1234)
# 1000 random integers between 0 and 50
x = np.random.randint(0, 50, 1000)

# Positive Correlation with some noise
y = x + np.random.normal(0, 10, 1000)
# Various correlations
np.corrcoef(x, y)
stats.pearsonr(x,y)
stats.spearmanr(x, y)
stats.kendalltau(x, y)
การหาค่า Maximal Information Coefficient (MIC)
ค่า Maximal Information Coefficient (MIC) เป็นวิธีทางสถิติประเภทหนึ่งในวิธีทางสถิติที่เรียกว่า Maximal Information-Based Nonparametric Exploration (MINE) โดยค่า MIC จะให้ค่าอยู่ในช่วงระหว่าง 0 ถึง 1.0 และสามารถนำมาใช้หาความสัมพันธ์ของข้อมูลได้ทั้งแบบเส้นตรงและไม่ใช่เส้นตรง (linear and non-linear association) กล่าวคือ หากค่า MIC ใกล้ 1.0 นั้นหมายความว่า ตัวแปรทั้งสองมีความสัมพันธ์กันอย่างมาก และหากค่า MIC เท่ากับ 0 นั้นหมายความว่า ตัวแปรทั้งสองตัวไม่มีความสัมพันธ์ต่อกัน
นอกจาก ค่า MIC จะสามารถนำมาใช้หาความสัมพันธ์ของข้อมูลได้หลากหลายรูปแบบแล้ว คุณสมบัติทางคณิตศาสตร์ของ ค่า MIC ยังสามารถนำมาใช้เป็นเกณฑ์เพื่อบ่งบอกว่าความสัมพันธ์ระหว่างตัวแปรสองตัวแปรนั้นมีความไม่เป็นเส้นตรงมากน้อยเพียงใด (degree of non-linearity) ในกรณีที่ความสัมพันธ์ของตัวแปรสองตัวแปรมีความสัมพันธ์กันแบบเส้นตรง ค่า MIC จะมีค่าใกล้เคียงกับค่า R-squared มาก (MIC – R2 ≈ 0) แต่หากความสัมพันธ์ของตัวแปรสองตัวแปรมีความสัมพันธ์กันแบบไม่เป็นเส้นตรง ผลต่างของ ค่า MIC กับ ค่า R-squared จะมีค่าสูงขึ้น (โปรดดูภาพที่ 3 ประกอบ)
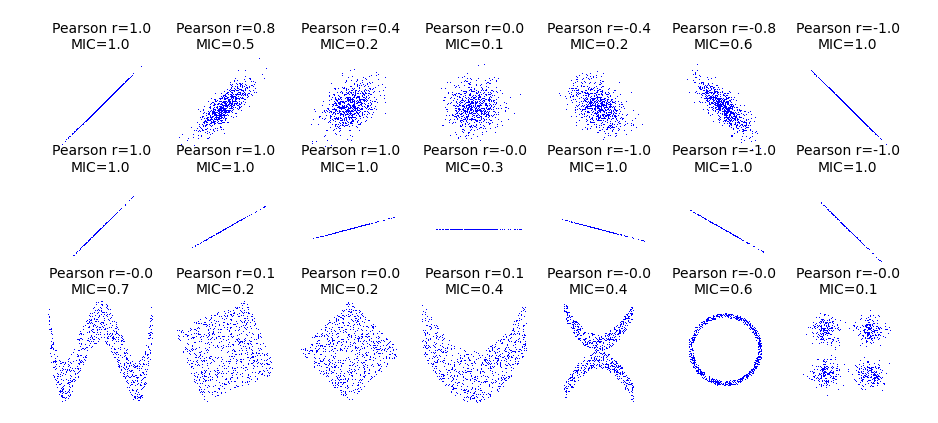
ที่มาภาพ: https://minepy.readthedocs.io/en/latest/
ข้างล่างเป็นตัวอย่างของโค้ดที่ใช้ในการคำนวณค่า MIC ในภาษา R และ ภาษา Python
R-Code[2]:
install.packages("minerva")
library(minerva)
x <- 0:200 / 200
y <- sin(10 * pi * x) + x
mine(x,y, n.cores = 1)
mine_stat(x, y, measure = "mic")
Python Code[3]:
import numpy as np
from minepy import MINE

def print_stats(mine):
    print("MIC", mine.mic())
    print("MAS", mine.mas())
    print("MEV", mine.mev())
    print("MCN (eps=0)", mine.mcn(0))
    print("MCN (eps=1-MIC)", mine.mcn_general())
    print("GMIC", mine.gmic())
    print("TIC", mine.tic())

x = np.linspace(0, 1, 1000)
y = np.sin(10 * np.pi * x) + x
mine = MINE(alpha=0.6, c=15, est="mic_approx")
mine.compute_score(x, y)

print("Without noise:")
print_stats(mine)
print()
บทสรุป
นอกจากวิธีการหาความสัมพันธ์ของข้อมูลด้วยค่า Correlation ประเภทต่างๆ และ ค่า Maximal Information Coefficient (MIC) ยังมีวิธิทางสถิติประเภทอื่น ๆ อีกมากมายที่ผู้เขียนมิได้กล่าวไว้ในบทความนี้ อาทิเช่น การหาค่าความสัมพันธ์เชิงดุลยภาพระยะยาว (Co-integration หรือ Granger Co-integration) ที่นิยมใช้ในการวิเคราะห์ข้อมูลอนุกรมเวลา หรือ การหาค่าความสัมพันธ์ระยะทาง (Distance correlation) เป็นต้น แต่ทุกวิธีล้วนมีข้อดีและข้อเสียที่ผู้ใช้ควรศึกษาให้เข้าใจก่อนที่จะนำมาใช้การวิเคราะห์ข้อมูล
ผู้เขียนหวังว่าตัวอย่างโค้ดที่ได้นำเสนอแบบสองภาษา (ทั้งภาษา R และ ภาษา Python) จะเป็นประโยชน์กับผู้ที่สนใจการเขียนโค้ดเพื่อใช้ในการวิเคราะห์ข้อมูล
อ้างอิง:
- Reshef DN, Reshef YA, Finucane HK, Grossman SR, McVean G, Turnbaugh PJ, Lander ES, Mitzenmacher M, Sabeti PC. Detecting novel associations in large data sets. Science. 2011 Dec 16;334(6062):1518-24. doi: 10.1126/science.1205438. PMID: 22174245; PMCID: PMC3325791.
- Davide Albanese, Michele Filosi, Roberto Visintainer, Samantha Riccadonna, Giuseppe Jurman and Cesare Furlanello. minerva and minepy: a C engine for the MINE suite and its R, Python and MATLAB wrappers. Bioinformatics (2013) 29(3): 407-408 first published online December 14, 2012 doi:10.1093/bioinformatics/bts707
[1] ผู้สนใจสามารถอ่านเพิ่มเติมได้ใน StackExchange (https://stats.stackexchange.com/questions/3943/kendall-tau-or-spearmans-rho)
[2] https://github.com/rsamantha/minerva
[3] https://github.com/minepy/minepy/blob/master/examples/python_example.py หรือ https://minepy.readthedocs.io/en/latest/python.html#first-example
เขียนโดย วรพิชญา ระเบียบโลก
ตรวจทานและปรับปรุงโดย นัทธมน มยุระสาคร
Vice President, Data Analytics Services Division (DAS)
Big Data Institute (Public Organization), BDI