
ในบางครั้งการสร้างโมเดลทำนาย เราไม่ได้สนใจเพียงแค่ว่าสิ่งทีทำนายออกมาจะเป็น class อะไร แต่สนใจไปถึงโอกาสหรือความน่าจะเป็นของผลการทำนายเพื่อจะเอาไปคำนวณ risk หรือ expected value อื่น ๆ ต่อไป
เชื่อว่าชาว data sci หลาย ๆ คน ถ้าอยากได้ผลการทำนายเป็น probability จะต้องเคยใช้ method .predict_proba ของ scikit learn อย่างแน่นอน แต่รู้หรือไม่ว่าจริง ๆ แล้ว prob ที่ได้จาก model บางประเภทนั้น มันไม่ตรงกับความเป็นจริง เช่น random forest ที่ใช้ probability เป็นสัดส่วนของจำนวน tree ที่ทำนาย class นั้น ๆ ออกมาต่อจำนวน tree ทั้งหมด ซึ่งจะแตกต่างจากโมเดลที่พยายามเรียนรู้และปรับค่า prob โดยตรงจากข้อมูลอย่าง neural network หรือ logistic regression หรือที่ปัญหาที่เรากำลังทำอยู่อาจจะ imbalance และซึ่งเราอาจะมีการ under, upsampling ระหว่างทำก็อาจจะทำให้โมเดลให้ค่า prob ได้ไม่ตรงกับความเป็นจริงเช่นเดียวกัน
Reliability Curve
แล้วที่บอกว่า prob มันไม่ตรง มันดูยังไง ก่อนอื่นเลย เราจะแนะนำให้ทุกท่านรู้จักกับกราฟนึงที่ชื่อว่า reliability curve (หรือ calibration curve) ซึ่งถ้าเอาโดยย่อมันคือการเทียบเลยว่า prob ที่โมเดลทำนายกับ prob ที่เกิดจริงใน test set ตรงกันรึเปล่า
โดยที่ reliability curve วิธีทำมันก็ง่าย ๆ ดังแสดงในขั้นตอนด้านล่าง
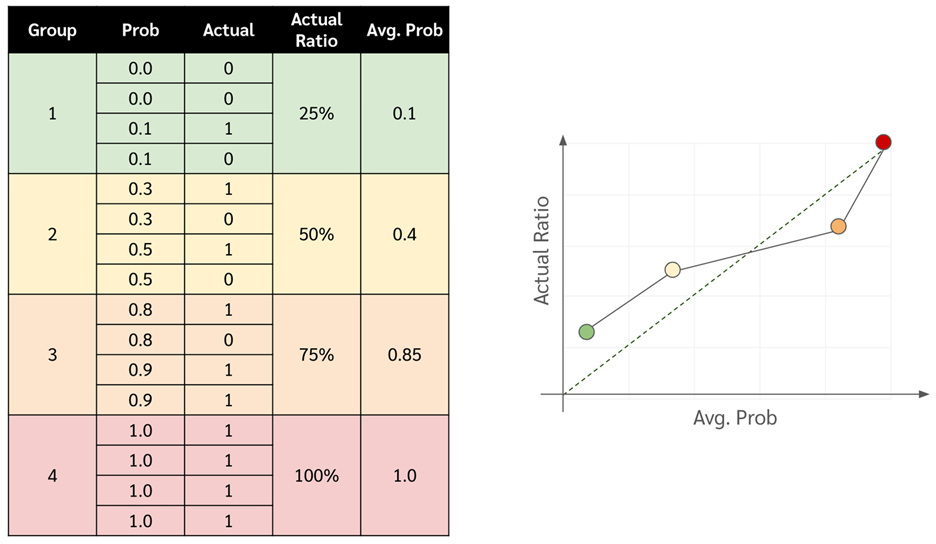
- เอาโมเดลมาทำนาย probability กับข้อมูล test set
- เรียงข้อมูลใน test set จาก probability มากไปน้อย
- แบ่งข้อมูลออกเป็นกลุ่ม ๆ แต่ละกลุ่มให้หา
- ค่าเฉลี่ยของ probability
- สัดส่วนระหว่าง class ที่สนใจต่อจำนวนข้อมูลทั้งหมดในกลุ่มนั้น ๆ
- Plot กราฟ โดยที่แกน x คือค่าเฉลี่ยของ probability และแกน y คือสัดส่วนของ class นั้น ๆ
หรือที่จริงถ้าใช้ sklearn ก็เรียก function sklearn.calibration.calibration_curve ได้เลย
โดยที่ถ้าหาก probability ที่โมเดลเราทำนายออกมามันตรงกับความจริง กราฟควรจะเป็นเส้นตรงตามแนวเส้นทแยงมุม แต่ถ้าโมเดลมันให้ prob ไม่ตรงเส้นมันก็จะไม่ค่อยอยู่ตรงเส้นทแยงมุมเท่าไหร่
ตัวอย่างดังรูปด้านล่าง
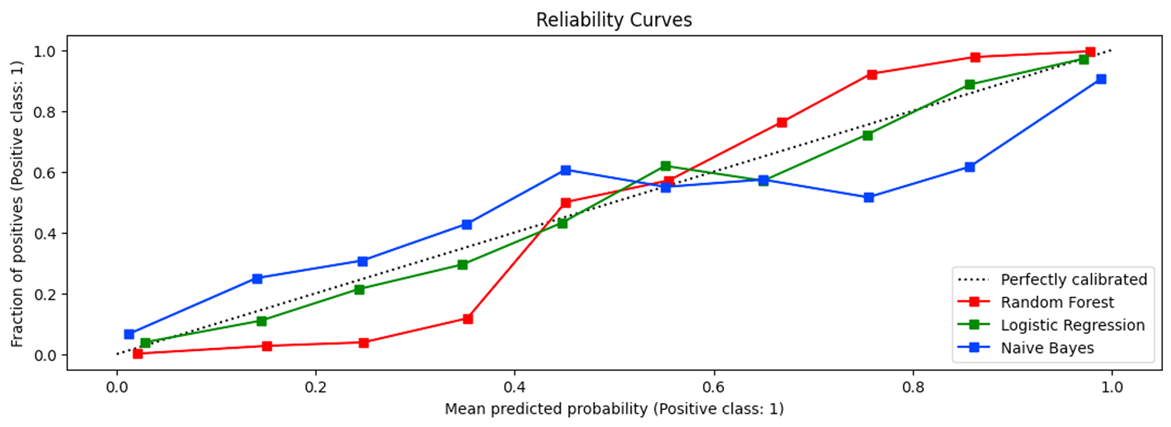
- เส้นสีเขียวจะมาจากโมเดลที่ให้ค่า prob ได้ใกล้เคียงกับความเป็นจริงมากที่สุด เนื่องจากอยู่แนบเส้นทแยงมุมมากที่สุด
- เส้นสีน้ำเงิน (Naive Bayes) แสดงถึงอาการ over-confidence
- จะเห็นว่าตอนที่แกน y ใกล้ 0 มาก ๆ หรือว่าข้อมูลส่วนใหญ่เป็น negative class โมเดลมันมักจะทำนาย prob ที่ต่ำกว่าความเป็นจริง หรือก็คือมั่นใจเกินเหตุว่าจะเป็น negative class
- แต่พอค่าแกน y ใกล้ ๆ 1 โมเดลมันก็ทำนายสูงกว่าความเป็นจริงอีก ก็คือมั่นใจเกินเหตุว่าจะเป็น positive class
- เส้นสีแดงที่เป็น s shape นั้นแสดงถึงอาการ under-confidence จะเห็นได้ว่า
- ตอนที่แกน y ใกล้ 0 มาก ๆ หรือว่าส่วนใหญ่ข้อมูลเป็น negative class โมเดลมันจะไปทำนาย prob สูงกว่าความเป็นจริง → หรือก็คือไม่มั่นใจว่าจะเป็น negative class (เช่น ตอนที่ y อยู่ในช่วง 0.0-0.1 มันทำนาย prob อยู่ในช่วง 0.0-0.4 )
- แต่พอค่าแกน y ใกล้ 1 มาก ๆ โมเดลมันจะไปทำนายต่ำกว่าความเป็นจริง → ไม่มั่นใจว่าจะเป็น positive class
โดยสรุปก็คือโมเดลที่สร้างเส้นนี้มักจะทายค่าแบบกลาง ๆ เช่น ระหว่าง 0.4-0.6 แต่จะไม่ค่อยมั่นใจแบบทาย prob ที่ 0 หรือ 1 เลย
How to Measure The Preciseness of Probability
โดยวิธีการวัดว่าโมเดลเราให้ prob ได้เพี้ยนมากน้อยเท่าไหร่สามารถวัดได้ด้วย Brier score ดังสูตรด้านล่าง ซึ่งมันก็เป็นแค่การลบ โดยถ้าหาก Brier score มีค่ามากแสดงว่าโมเดลเราเพี้ยนเยอะ
[latexpage]
$BS = \frac{1}{n} \sum_{i=1}^{n} (\hat{p}(y_i) – y_i)^2$
โดยตัวแปร
- $n$ คือจำนวนข้อมูลทั้งหมดใน validation set
- $\hat{p}(y_i)$ คือ probability ของการเป็น positive class (ค่า 1)
- $y_i$ คือจริง เช่น เป็น 0 หรือ 1
Calibration Method
โดยที่เราสามารถปรับ probability ให้ตรงกับความเป็นจริงได้ด้วยการทำ probability calibration นั่นเอง โดยการทำ probability calibration นั้นจะนับว่าเป็นการทำ post processing หรือเป็นกระบวนการที่เกิดขึ้นหลังจากเรา train AI model เรียบร้อยแล้ว ซึ่งการทำ probability calibration นั้นควรจะทำบน validation set เนื่องจากว่าบน training set นั้นมีโอกาสที่ model เราจะ overconfidence อยู่แล้ว เพราะมันเคยเห็นคำตอบมาก่อนหน้าแล้ว โดยที่การทำ probability calibration นั้นจะมี algorithm อยู่หลายอันด้วยกัน แต่ในบทความนี้จะยกตัวอย่างสองวิธี ได้แก่ platt scaling และ isonotic regression
Platt Scaling
ใช้เมื่อกราฟ reliability curve ของโมเดลหน้าตาเหมือน sigmoid function (เส้นสี xxx ในภาพที่ xxx ด้านบน) ซึ่งโดยตั้งต้นแล้วตัวมันเองก็ถูกคิดค้นขึ้นมาเพื่อ map ระหว่างผลลัพธ์ของโมเดล SVM (ที่มีค่าระหว่าง -inf ไปถึง +inf) ไปเป็น probability (ที่มีค่าระหว่าง 0 ถึง 1) ซึ่งถ้าเราคุ้นเคยกับการใช้งานแบบนี้มาก่อนจะนึกได้ว่าที่จริงมันคือ sigmoid function เลยนี่นา ซึ่งถ้าพูดให้ถูกตัว Platt scaling มันเหมือน sigmoid function ที่เป็นสามารถเรียนรู้จากข้อมูลได้ โดยจะเห็นได้ว่าสมการของมันจะมีหน้าตาที่คล้าย sigmoid function พอสมควร
$P(y = 1 | f) = \frac{1}{1 + \exp(Af + B)}$
โดยจากสมการนั้น
- $f$ คือโมเดล machine learning เรา เช่น support vector classifier ที่ให้ผลลัพธ์เป็น probability ที่ยังไม่ calibrated
- $P(y=1|f)$ คือผลลัพธ์ probability หลังการ calibrate แล้ว
- $A$ และ $B$ คือ parameter ที่ได้จากการเรียนรู้บนข้อมูล validation set โดยที่การเรียนรู้ค่า $A$ และ $B$ นั้นจะใช้ gradient descent เพื่อ minimize ค่า binary cross entropy loss
โดยข้อดีของ Platt Scaling นั้นคือมันใช้ข้อมูลที่น้อย (น้อยกว่า isotonic regression ที่จะกล่าวถึงต่อไป) ก็สามารถให้ผลลัพธ์การ calibrate ที่ดีได้ แต่ข้อเสียคือไม่ค่อย flexible กล่าวคือจะทำงานได้ดีกับโมเดลที่ให้ probability บน reliability curve แบบ sigmoid เท่านั้น
Isotonic Regression
ในส่วนของ Isotonic Regression นั้นค่อนข้างจะ flexible กว่าตัวของ Platt Scaling ตรงที่สามารถทำงานบน reliability curve แบบใดก็ได้ แต่ก็ต้องแลกมาด้วยการใช้ข้อมูลจำนวนที่มากกว่าในการ fit ตัวมัน (มี dataset สำหรับ calibrate probability มากกว่า 1,000 จุด) โดยตัวมันเองจะมี function เหมือนขั้นบันได ที่จะค่อย ๆ ปรับความยาวแต่ละขั้น และไล่ขึ้นไปให้ map ค่า prob ที่ไม่ตรงกับความเป็นจริงให้ใกล้ความเป็นจริงมากที่สุด (ใกล้เส้นทแยงมุมมากที่สุด)
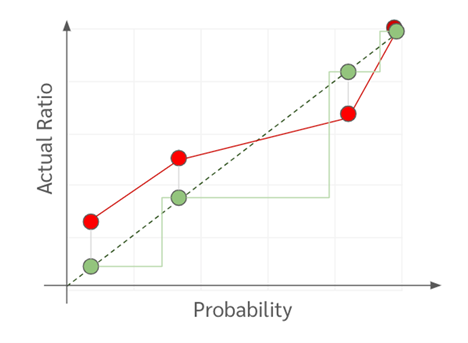
จากภาพอาจจะพอทำให้เห็นภาพได้ว่าทำไมเราจึงต้องการข้อมูลจำนวนมากเพื่อ fit isotonic regression จะเห็นได้ว่าถ้าหากมีจำนวนข้อมูลน้อยเราอาจจะแบ่งออกมาสร้างได้ไม่กี่ bin ตัวบันไดเราก็จะมีไม่กี่ขั้นแล้วก็ไม่ค่อย smooth นั่นเอง
บทความโดย ธรรมสรณ์ หาญผดุงกิจ
ตรวจทานและปรับปรุงโดย นววิทย์ พงศ์อนันต์
ศึกษาเพิ่มเติมได้ที่ Link
เอกสารอ้างอิง
- https://towardsdatascience.com/a-comprehensive-guide-on-model-calibration-part-1-of-4-73466eb5e09a
- https://machinelearningmastery.com/probability-calibration-for-imbalanced-classification/
- https://amueller.github.io/COMS4995-s20/slides/aml-10-calibration-imbalanced-data/#7
- https://towardsdatascience.com/a-comprehensive-guide-on-model-calibration-part-1-of-4-73466eb5e09a
- https://medium.com/@wolframalphav1.0/evaluate-the-performance-of-a-model-in-high-risk-applications-using-expected-calibration-error-and-dbc392c68318
- https://scikit-learn.org/stable/modules/calibration.html
- http://www.datascienceassn.org/sites/default/files/Predicting good probabilities with supervised learning.pdf
- https://wttech.blog/blog/2021/a-guide-to-model-calibration/
- https://docs.google.com/spreadsheets/d/1T0rZJeBZoTayRpIyJ04CK3xQufeaGG49LmmslILdFuo/edit#gid=0
- https://www.cs.cornell.edu/~alexn/papers/calibration.icml05.crc.rev3.pdf

Data Science Specialist
Data Wow