
ในยุคที่ข้อมูลเป็นหัวใจสำคัญของการตัดสินใจทางธุรกิจ การนำเสนอข้อมูลที่ซับซ้อนให้เข้าใจง่ายถือเป็นความท้าทายอันดับต้น ๆ ของนักวิเคราะห์ข้อมูล แต่คุณเคยนึกภาพไหมว่า หากสามารถแปลงแผนผังอาคาร แผนที่ หรือแม้แต่ภาพวาดให้กลายเป็น Dashboard แบบ Interactive ได้ล่ะ? นี่คือสิ่งที่ Synoptic Panel ใน Power BI ทำได้!
Synoptic Panel คืออะไร และทำไมต้องใช้?
Synoptic Panel เป็น Visual Customization ที่ช่วยให้คุณสามารถแปลงภาพนิ่งให้กลายเป็น interactive dashboard โดยการเชื่อมโยงพื้นที่ต่างๆ ในภาพเข้ากับข้อมูลของคุณ ทำให้การนำเสนอข้อมูลมีความน่าสนใจและเข้าใจง่ายมากขึ้น
หลักการทำงานของ Synoptic Panel
Synoptic Panel มีหลักการทำงานโดย เชื่อมโยงข้อมูลกับภาพ ซึ่งคุณสามารถนำภาพใด ๆ มาใช้ เช่น แผนผังโรงงาน แผนที่โลก หรือแม้แต่แผนภูมิองค์กร แล้วกำหนดให้แต่ละส่วนของภาพนั้นแสดงค่าข้อมูลที่คุณต้องการ จากนั้นแสดงผลแบบไดนามิก เมื่อมีการเลือกข้อมูลในส่วนอื่น ๆ ของรายงาน Power BI ภาพที่อยู่ใน Synoptic Panel จะเปลี่ยนแปลงไปตามข้อมูลที่เลือก ทำให้เห็นภาพความสัมพันธ์ของข้อมูลได้อย่างชัดเจน
ข้อดีของ Synoptic Panel
- สร้าง Visualization ที่สอดคล้องกับบริบทจริงของข้อมูล
- เพิ่มความน่าสนใจในการนำเสนอด้วยภาพที่คุ้นตา
- ช่วยให้ผู้ใช้งานเข้าใจข้อมูลได้เร็วขึ้นผ่านการมองเห็น
- สามารถ drill-down ข้อมูลได้โดยตรงจากภาพ
- ใช้ได้กับภาพทุกประเภท
ข้อจำกัดของ Synoptic Panel
- คุณต้องมีภาพที่ต้องการนำมาใช้ก่อน เพื่อให้การนำเสนอแดชบอร์ดสามารถเข้าใจได้ง่าย
- การออกแบบภาพให้สวยงามและใช้งานได้ง่าย อาจต้องใช้ความรู้ทางด้านกราฟิกประกอบ
ตัวอย่างการประยุกต์ใช้งาน
โจทย์ : ความพร้อมของเตียงและรถเข็นในจุดบริการตรงทางเข้าของโรงพยาบาล
สิ่งที่ต้องรู้คือ
- จำนวนเตียงและจำนวนรถเข็นในห้องเก็บของ
- จำนวนเตียงและจำนวนรถเข็นตรงจุดบริการ
เราต้องการทราบจำนวนเตียงและจำนวนรถเข็นของแต่ละที่เพื่อให้มีเตียงและรถเข็นให้เพียงพอต่อการใช้บริการ เริ่มขั้นแรกด้วยการวาดแปลนง่ายๆ โดยมีห้องเก็บของทั้งหมด 4 ห้องในตำแหน่งหมายเลข 1, 2, 3 และ 4 และจุดบริการเตียงและรถเข็น 2 จุด ณ ตำแหน่งหมายเลข 5 และ 6 ดังรูปที่ 1
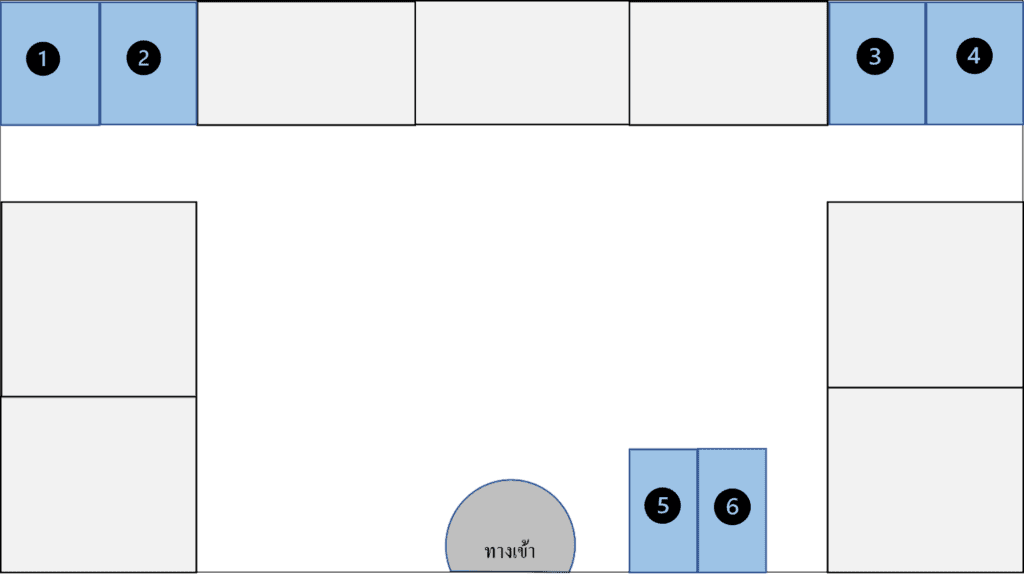
รูปที่ 1 แผนที่แสดงตำแหน่งของห้องเก็บของและจุดบริการ
จากนั้นนำรูปเข้า Synoptic Designer ซึ่งเป็นเครื่องมือที่จะช่วยกำหนดขอบเขตของห้องแต่ละห้อง เมื่อนำเข้าแล้วเราก็จะสามารถนำรูปที่เราวาดไว้เข้ามาแสดงในแดชบอร์ดได้ โดยกำหนด Area name ให้ครบทุกห้อง เมื่อกำหนดเสร็จแล้ว กด Export to Power BI ไฟล์ที่ได้เป็นประเภทไฟล์นามสกุล svg
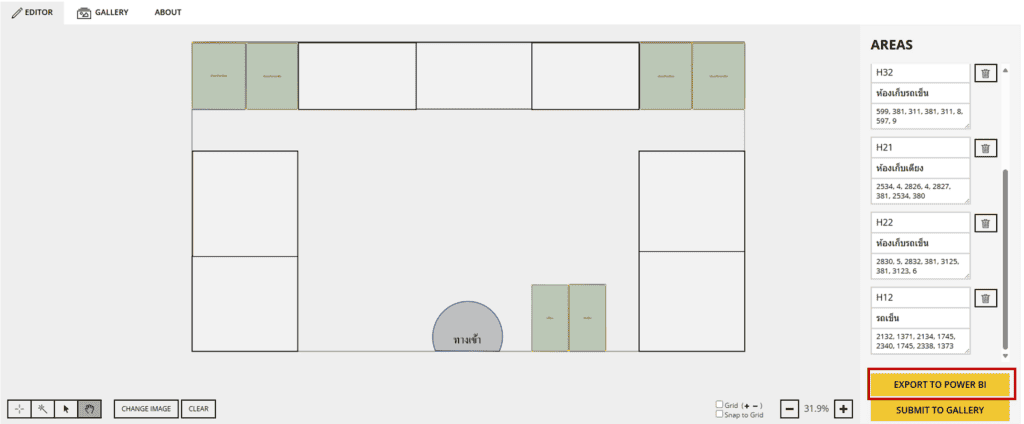
รูปที่ 2 การนำเข้าไฟล์และการกำหนดค่าใน Synoptic Designer
ใน Power Bi เลือก Get more visuals
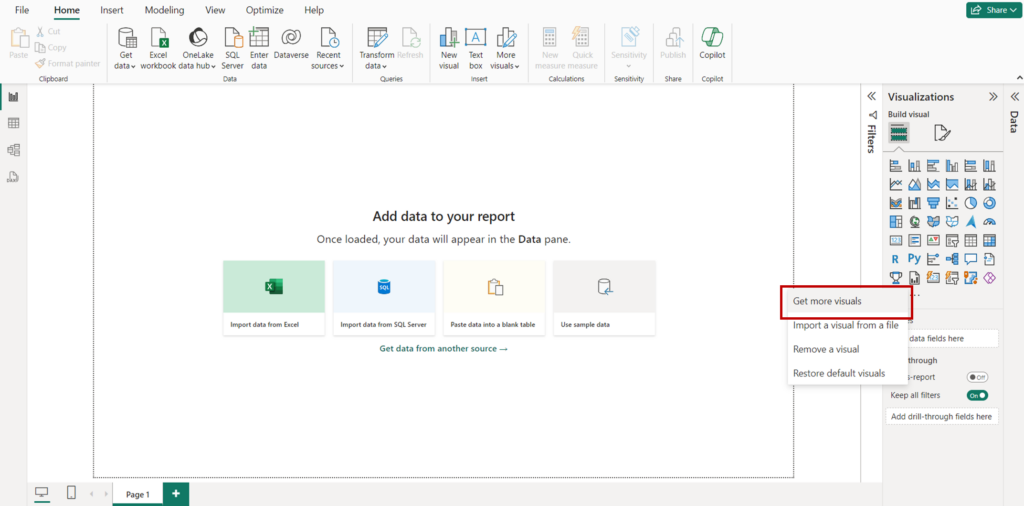
รูปที่ 3 การนำเข้า Visual ใน Power Bi
ค้นหา Synoptic Panel by OKViz หลังจากนั้นให้เลือก Add
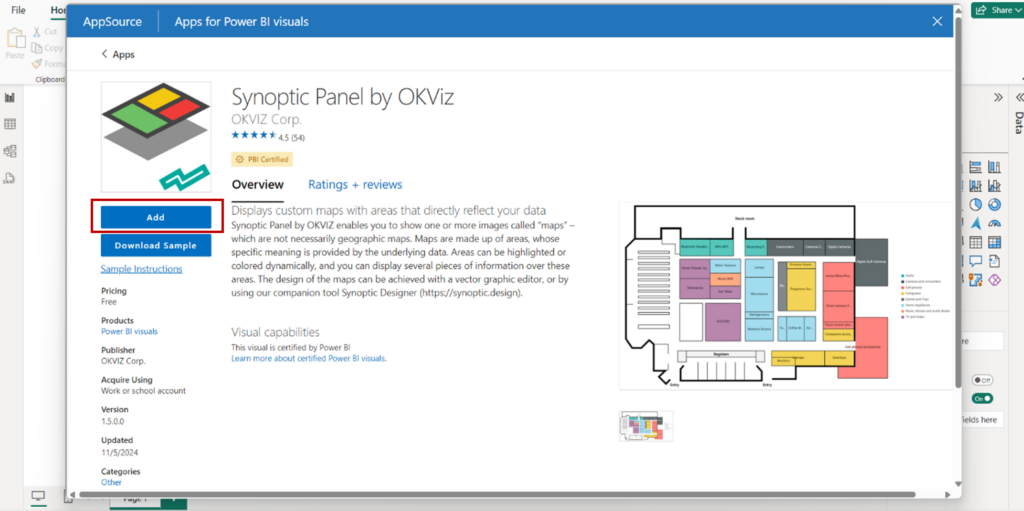
รูปที่ 4 นำเข้า Visual
ตัวอย่างข้อมูล :
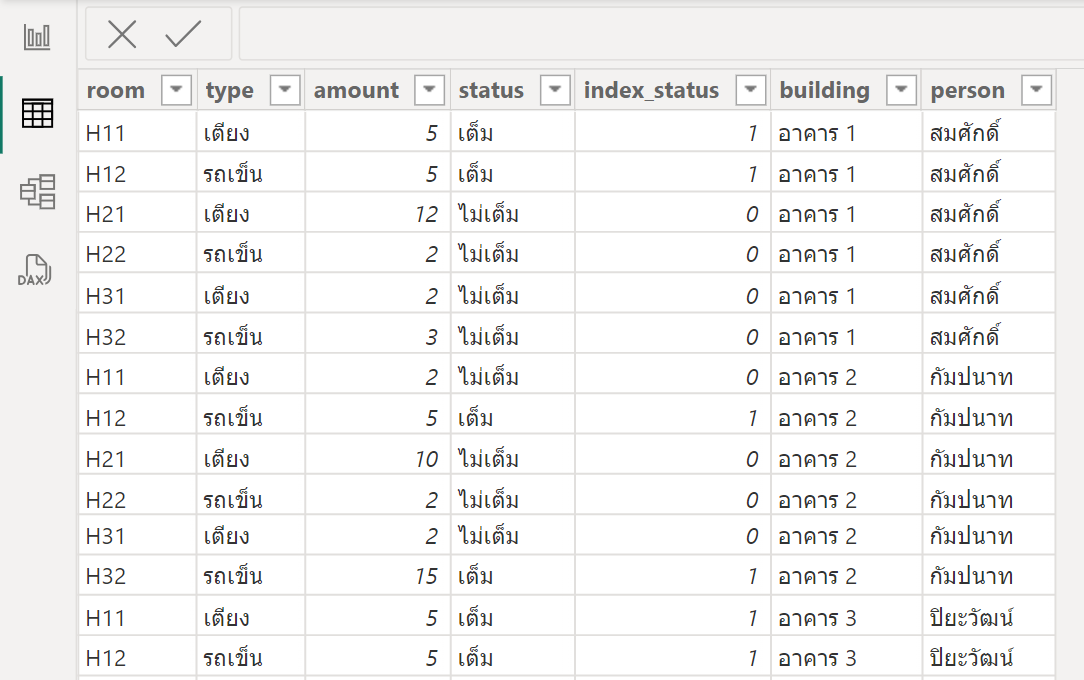
รูปที่ 5 ตัวอย่างข้อมูล
เมื่อนำเข้า Visual แล้ว หลังจากนั้นให้ลากและวางฟิลด์ในช่องที่กำหนด ในส่วนของ Visual เลือก Local maps จากนั้นเลือกรูปที่สร้างไว้ โดยเป็นไฟล์นามสกุล .svg
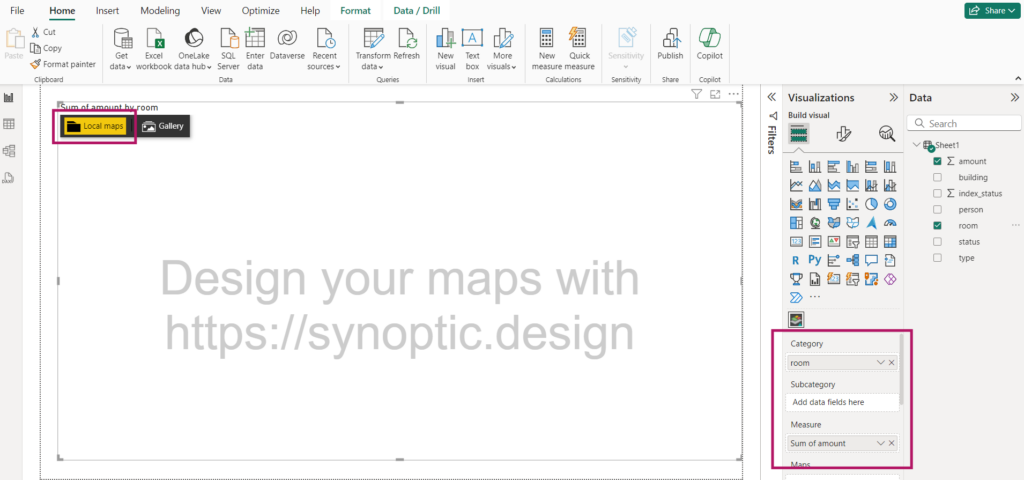
รูปที่ 6 กำหนดฟิลด์ในช่องการแสดงผล
เมื่อนำเข้าไฟล์ที่ต้องการแล้ว หลังจากนั้นนำฟิลด์ index_Status มาใส่ใน States Measure เพื่อใช้ในการกำหนดสีของสถานะของจำนวนรถเข็นและเตียง
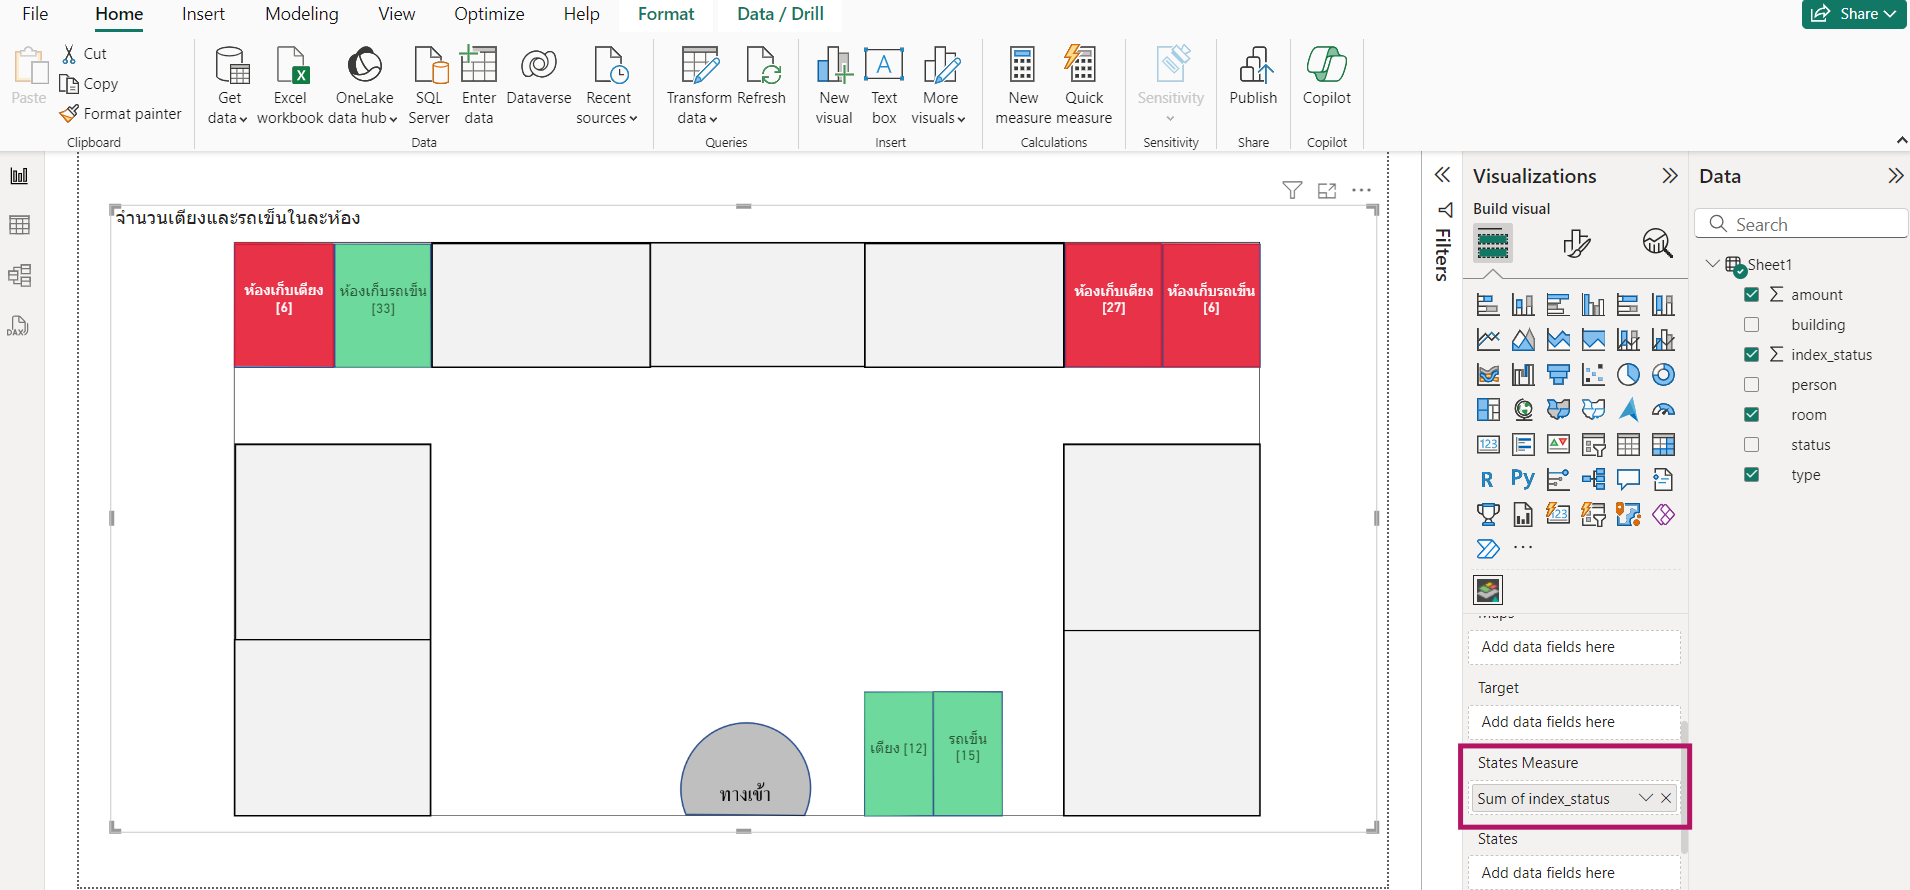
รูปที่ 7 การแสดงสถานะของจำนวนรถเข็นและเตียง
เพิ่ม Visual อื่นๆ เช่น Slicer เพื่อเลือกอาคารที่สนใจ เพิ่มการแสดงจำนวนเตียงและรถเข็นรวมในแต่ละอาคาร และแสดงชื่อผู้รับผิดชอบที่มีหน้าที่ดูแล จุดบริการเตียงและรถเข็น
ผลลัพธ์ที่ได้ :
รูปที่ 8 การแสดงผลลัพธ์ที่ได้
Synoptic Panel ไม่ใช่แค่ Visual ธรรมดา แต่เป็นเครื่องมือที่ช่วยยกระดับการนำเสนอข้อมูลของคุณให้มีประสิทธิภาพมากขึ้น ด้วยความสามารถในการเชื่อมโยงข้อมูลเข้ากับภาพจริง ทำให้ผู้ใช้งานเข้าใจข้อมูลได้เร็วขึ้น และสามารถตัดสินใจได้แม่นยำมากขึ้น ไม่ว่าคุณจะทำงานในภาคการผลิต การจัดการอาคาร หรือการวิเคราะห์พื้นที่ขาย Synoptic Panel จะช่วยให้การนำเสนอข้อมูลที่มีประสิทธิภาพมากขึ้นอย่างแน่นอน
บทความอ้างอิง
บทความโดย พรวิภา มีเคลือบ
ตรวจทานและปรับปรุงโดย ขวัญศิริ ศิริมังคลา