
ในทศวรรษที่ผ่านมา ข้อมูลมหาศาลถูกสร้างขึ้นโดยอัตโนมัติ และเพื่อให้ได้มาซึ่ง Insight จากข้อมูลเหล่านั้น รูปแบบและวิธีการวิเคราะห์ข้อมูลต่างๆได้เกิดขึ้นจำนวนมากและหลากหลาย อย่างไรก็ตามความสามารถทางสัมผัสและสติปัญญาของมนุษย์ที่จะเข้าใจธรรมชาติของข้อมูลที่ซับซ้อนเหล่านั้นมีอยู่จำกัด จะมีหนทางหรือวิธีการใดที่ทำให้มนุษย์สามารถเข้าใจข้อมูลได้อย่างง่ายและรวดเร็วได้บ้าง
Visual Analytics คืออะไร
“ภาพหนึ่งภาพ สื่อความหมายแทนหลายร้อยคำ”
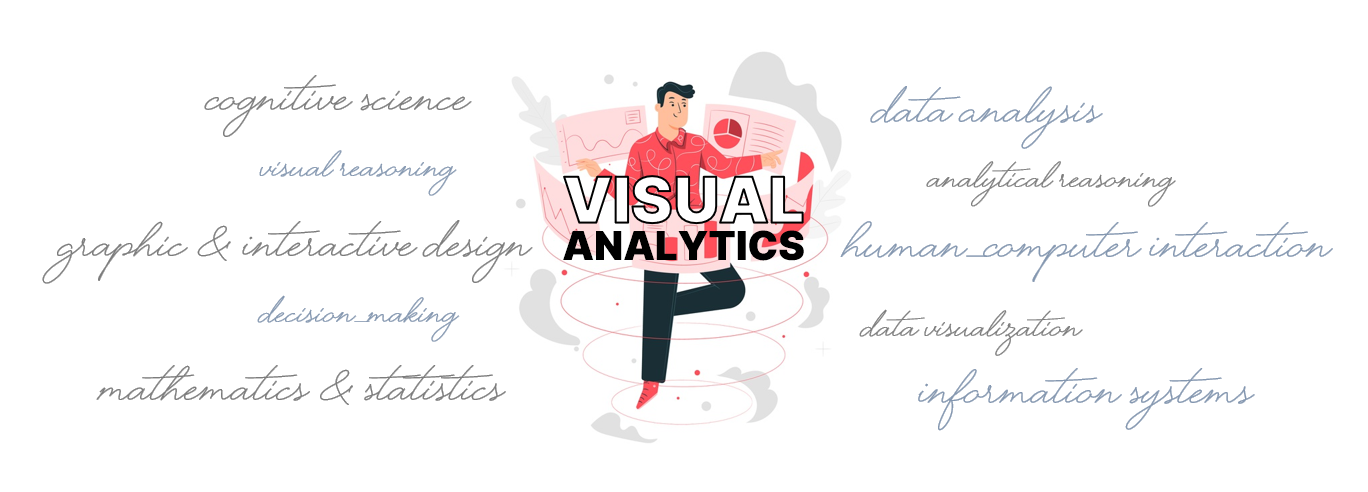
Visual Analytics หรือ การวิเคราะห์ด้วยภาพ คือการใช้เหตุผลเชิงวิเคราะห์ (Analytical Reasoning) ซึ่งว่าด้วยการมองดูข้อมูลในเชิงปริมาณหรือปริมาตรแล้วสามารถสกัดเอาความรู้หรือข้อสรุปออกมาได้ ประกอบด้วยหลายศาสตร์มากมาย เช่น Cognitive Science, Information Systems, Graphic & Interactive Design, Human-Computer Interaction, Mathematics & Statistical Methods, Data Analysis ซึ่งมี Interactive Visual Interfaces เป็นเครื่องมือและสื่อกลาง
การวิเคราะห์ด้วยภาพเป็นการวิเคราะห์ข้อมูลโดยใช้รูปภาพเพื่อสื่อความ ไม่มีส่วนเกี่ยวข้องและเป็นคนละเรื่องกับศาสตร์ของการประมวลผลภาพดิจิทัล หรือ Digital Image Processing
Visual Analytics จะช่วยเพิ่มกำลังความสามารถในการรับรู้และเข้าใจของมนุษย์ได้ต่อไปนี้
- ลดการทำงานในส่วนความจำ โดยใช้ภาพที่มองเห็นด้วยตาเปล่าเป็นสื่อรับรู้
- ลดการค้นหาที่หนักและซับซ้อน โดยการนำเสนอข้อมูลที่มีขนาดใหญ่ในพื้นที่แสดงขนาดเล็ก
- ใช้รูปแบบเฉพาะเพื่อให้เราสามารถเข้าใจความหมายได้อย่างรวดเร็ว เช่น แผนภูมิวงกลม (Pie chart) หมายถึงสัดส่วนของข้อมูล
- ช่วยในการอนุมานความสัมพันธ์ให้ง่ายขึ้น
- ติดตามเหตุการณ์หรือปรากฎการณ์ในข้อมูลหลายเรื่อง ๆ ให้สามารถมองเห็นได้ด้วยตาเปล่า
- มีเครื่องมือเพื่อให้จัดการเปลี่ยนแปลงค่าพารามิเตอร์ต่าง ๆ ทำให้ทำการสำรวจได้มากยิ่งขึ้น ต่างจากรูปภาพนิ่งที่ไม่สามารถเปลี่ยนแปลงค่าใด ๆ ได้
Visual Analytics VS. Data Visualization
Data Visualization คือ การแสดงข้อมูลในรูปแบบรูปภาพนิ่ง เช่น รูปกราฟแท่ง รูปพายกราฟ เป็นต้น เพื่อให้มนุษย์สามารถเข้าใจข้อมูลได้ง่ายขึ้น มีจุดประสงค์หลัก ๆ ได้แก่ ถ่ายทอดสิ่งที่ข้อมูลต้องการสื่อสารอย่างชัดเจน ช่วยอธิบายแนวโน้มทางสถิติ แสดงรูปแบบเฉพาะในข้อมูลที่ยากจะเห็นด้วยตาเปล่า
Visual Analytics คือ ศาสตร์และกระบวนการที่วิเคราะห์ข้อมูลแล้วใช้ Data Visualization เป็นเครื่องมือหรือสื่อ เพื่อให้ผู้ใช้งานสามารถสำรวจ ค้นหา และเข้าใจข้อมูลได้ตามที่ต้องการ ซึ่งจะบรรลุจุดประสงค์เหล่านี้ได้ก็ต่อเมื่อ Data Visualization นั้นสามารถโต้ตอบกับความต้องการของผู้ใช้ได้หรือที่เรียกว่า Interactive นั้นเอง
ทำไมต้อง Visual Analytics
ปัจจุบันมีเครื่องมือสำหรับ Visual Analytics หลายหลายยี่ห้อ เช่น Tableau, Microsoft PowerBI, SAS เป็นต้น ซึ่งสามารถสร้างสรรค์ Interactive Dashboards หรือรายงานให้ตอบคำถามของผู้ใช้และสามารถเข้าใจได้ง่าย นอกจากนี้ยังมีความสามารถในการปรับแต่งค่าหรือกรองดูผลลัพธ์ต่าง ๆ ได้อย่างทันใจ ซึ่งจะเป็นผลดีเมื่อเจอสถานการณ์ที่ผู้ใช้ต้องการวิเคราะห์ข้อมูลเพื่อทำการตัดสินใจอย่างรวดเร็วทันที
ด้วยการที่ Visual Analytics สามารถเข้าถึงหลากหลายกลุ่มผู้ใช้งานไม่ได้จำกัดเฉพาะกลุ่มนักวิเคราะห์ข้อมูลเท่านั้น ทำให้เครื่องมือและเทคโนโลยีในสาขานี้มีความก้าวหน้าและถูกนำไปใช้ในงานหลายแขนงมากขึ้นด้วย เช่น งานด้านวิจัย งานด้านการศึกษา งานด้านการเกษตร เป็นต้น
บทสรุป
Visual Analytics และ Data Visualization นั้นคือคนละอย่างกัน แต่ในขณะเดียวกันทั้งสองอย่างก็ขาดซึ่งกันและกันไม่ได้ ซึ่งความสำคัญของทั้งสองอย่างนี้คือ เพื่อให้ข้อมูลที่มีจำนวนมากและซับซ้อนได้ถูกอธิบายให้มนุษย์ได้เข้าใจ และนำไปใช้ประโยชน์อย่างสูดสุด ดีกว่าให้ข้อมูลถูกทิ้งไว้โดยไร้ประโยชน์
แหล่งอ้างอิง
- https://www.sisense.com/blog/data-visualization-and-visual-analytics-seeing-the-world-of-data/
- Thomas, J., Cook, K.: Illuminating the Path: Research and Development Agenda for Visual Analytics. IEEE-Press (2005)
- https://en.wikipedia.org/wiki/Visual_analytics
- https://infinitylimited.co.uk/visual-analytics-key-attributes-scope-and-advantages/
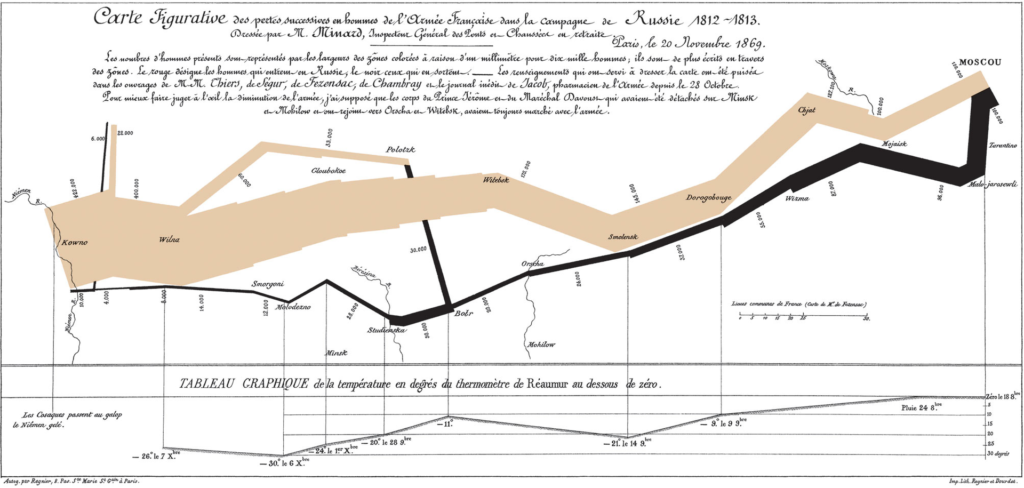
- [1] Charles Joseph Minard’s 1869 diagram of Napoleonic France’s invasion of Russia, an early example of an information graphic https://en.wikipedia.org/wiki/Data_visualization#/media/File:Minard.png
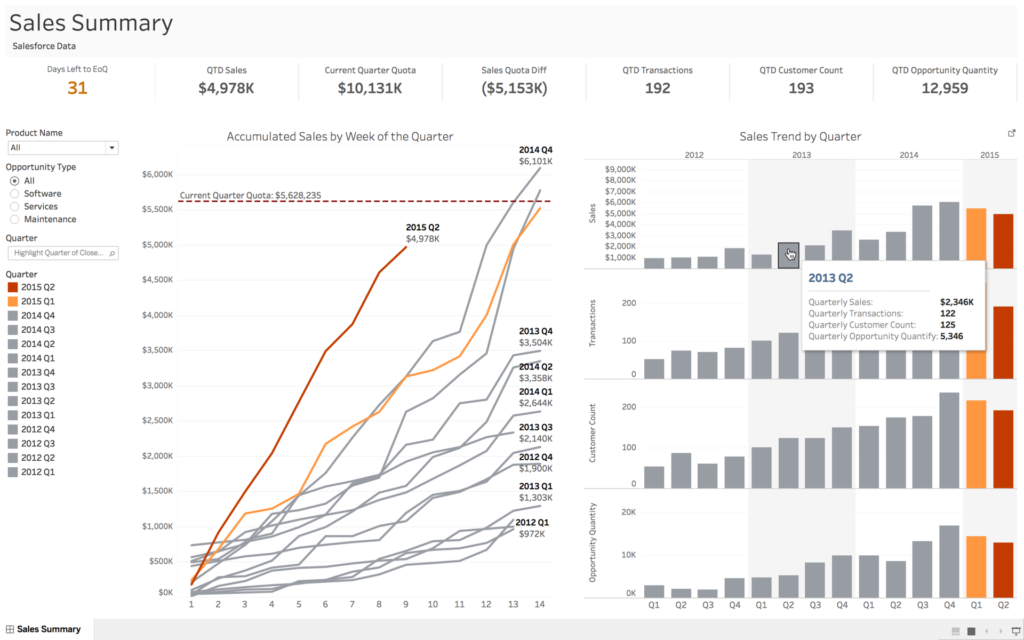
- [2] Visualization created by Tableau Software https://en.wikipedia.org/wiki/Tableau_Software#/media/File:Executive_Salesforce_Sales_Summary.png