
แผ่นดินไหวเป็นภัยธรรมชาติที่สร้างความเสียหายมหาศาลต่อชีวิตและทรัพย์สิน การเข้าใจรูปแบบการเกิดแผ่นดินไหวผ่านการวิเคราะห์ข้อมูลและการแสดงผลข้อมูลเชิงภาพ (Data Visualization) จึงมีบทบาทสำคัญอย่างยิ่งในการเตรียมพร้อมรับมือและลดผลกระทบจากภัยพิบัติดังกล่าว บทความนี้นำเสนอวิธีการใช้ Data Visualization เพื่อทำความเข้าใจแผ่นดินไหวในมิติต่าง ๆ
ความสำคัญของ Data Visualization ในการศึกษาแผ่นดินไหว
การแสดงผลข้อมูลเชิงภาพช่วยให้เราสามารถเห็นรูปแบบและความสัมพันธ์ของข้อมูลที่ซับซ้อนได้อย่างชัดเจน สำหรับปรากฏการณ์แผ่นดินไหว การใช้ Data Visualization มีประโยชน์หลายประการ ดังนี้
- แสดงการกระจายตัวเชิงพื้นที่ ซึ่งช่วยให้เห็นว่าแผ่นดินไหวเกิดขึ้นบริเวณใดบ้าง โดยเฉพาะบริเวณรอยเลื่อนของเปลือกโลก
- วิเคราะห์ความถี่และความรุนแรง ผ่านการแสดงให้เห็นว่าแผ่นดินไหวมีความถี่และความรุนแรงอย่างไรในแต่ละพื้นที่
- ติดตามแนวโน้มเชิงเวลา เพื่อให้เห็นรูปแบบการเกิดแผ่นดินไหวตามช่วงเวลาต่าง ๆ ในที่นี้รวมถึงขนาดความรุนแรงและความถี่ที่มีการเปลี่ยนแปลงตามเวลา
- สื่อสารความเสี่ยงกับสาธารณะ ทำให้ข้อมูลที่ซับซ้อนสามารถเข้าใจได้ง่ายสำหรับประชาชนทั่วไป
การติดตามแผ่นดินไหว ณ เวลาปัจจุบัน (Real-time earthquake monitoring)
ปัจจุบันมีระบบติดตามแผ่นดินไหวแบบเรียลไทม์หลายระบบ เช่น USGS Earthquake Map ที่จัดทำโดยสำนักงานธรณีวิทยาแห่งสหรัฐอเมริกา (USGS) โดยสามารถแสดงข้อมูลแผ่นดินไหวทั่วโลกแบบเรียลไทม์ (ภาพที่ 1) แสดงแผนที่ตำแหน่งการเกิดเหตุแผ่นดินไหวที่เกิดขึ้นล่าสุด
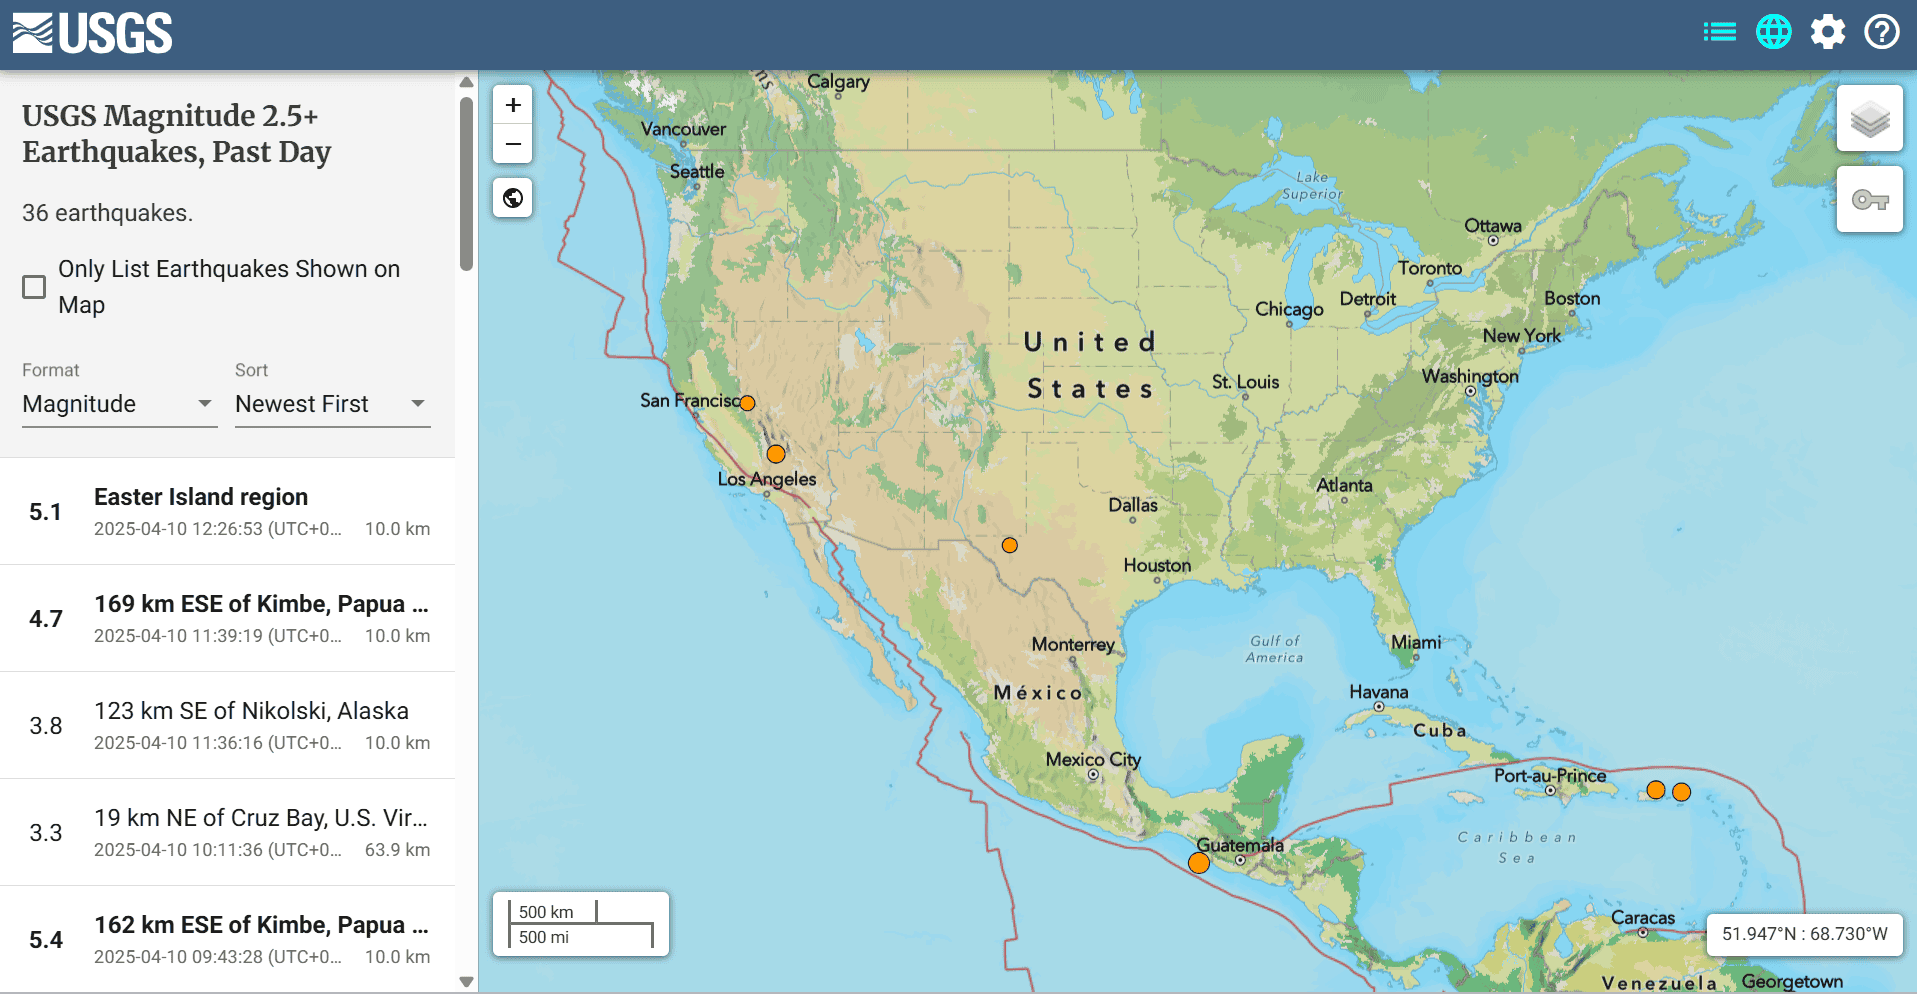
เพื่อให้สามารถเข้าใจได้โดยง่าย แผนที่การเกิดแผ่นดินไหวจึงมักอยู่ในรูปแบบพื้นฐานที่ใช้แสดงตำแหน่งของแผ่นดินไหว โดยนิยมใช้จุด (Points) ที่มีขนาดและสีแตกต่างกันเพื่อแสดงความรุนแรงของแผ่นดินไหว
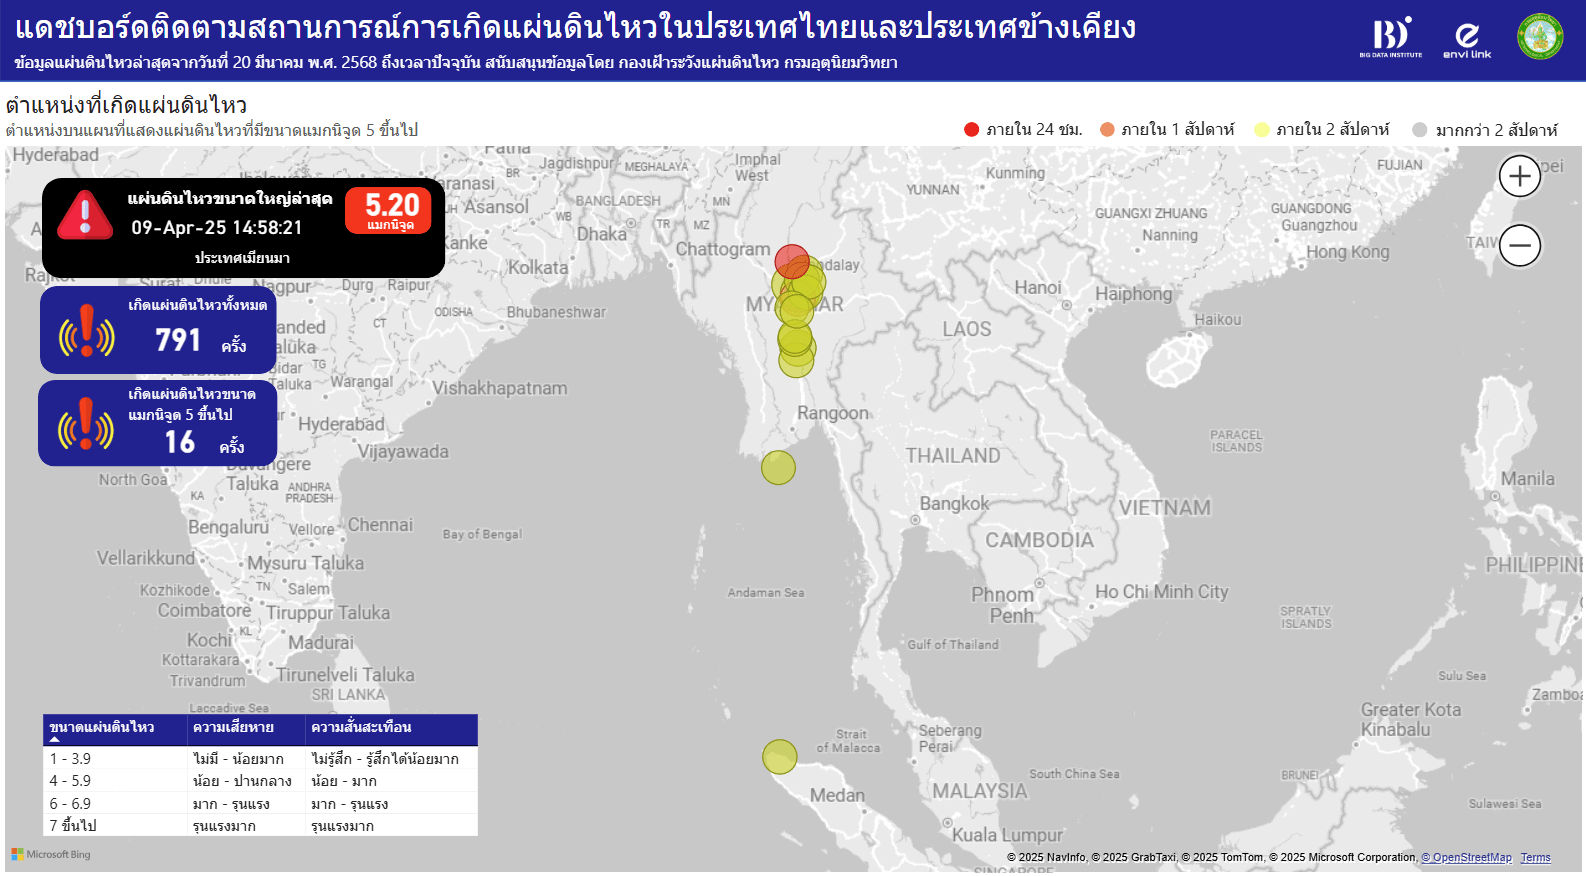
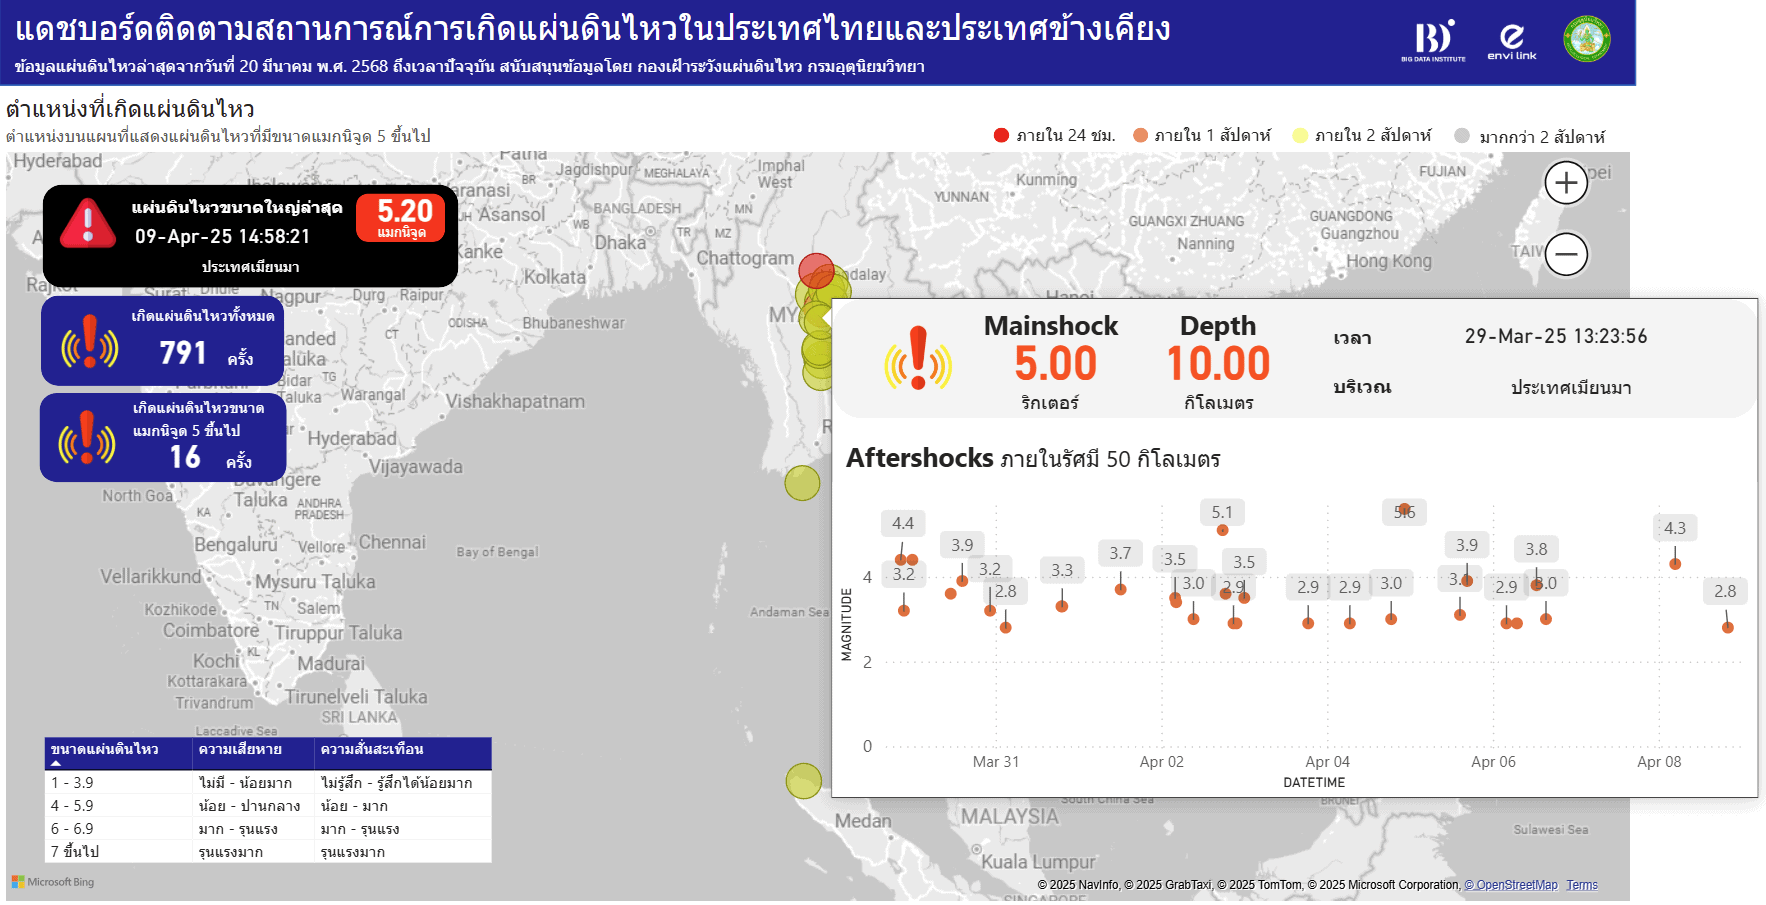
การประยุกต์ใช้ Data Visualization ในการศึกษาแผ่นดินไหวมีความท้าทายสำคัญประการแรกคือการจัดการกับข้อมูลขนาดใหญ่ที่ไหลมาจากเครือข่ายเซนเซอร์จำนวนมาก ซึ่งจำเป็นต้องพัฒนาระบบการประมวลผลและแสดงผลแบบเรียลไทม์เพื่อให้ข้อมูลล่าสุดพร้อมใช้งานสำหรับการวิเคราะห์และติดตามสถานการณ์ นอกจากนี้ การออกแบบ Visualization ที่ซับซ้อนให้เข้าใจง่ายสำหรับประชาชนทั่วไปยังเป็นอีกความท้าทาย เพื่อให้การสื่อสารความเสี่ยงและการเตรียมพร้อมรับมือภัยพิบัติเป็นไปอย่างมีประสิทธิภาพ ปัจจุบัน สถาบันข้อมูลขนาดใหญ่ (องค์การมหาชน) ได้มีการจัดทำแดชบอร์ดติดตามสถานการณ์การเกิดแผ่นดินไหวในประเทศไทยและประเทศข้างเคียง (ภาพที่ 2) ซึ่งสามารถติดตามการกระจายตัว ขนาด ความถี่ รวมถึงแนวโน้มเชิงเวลาของ aftershocks ที่ปกติจะมีการเกิดขึ้นตามมาหลังจากการเกิดแผ่นดินไหวลูกใหญ่ (mainshock) ซึ่งโดยปกติจำนวน ขนาด และความถี่ของ aftershocks จะลดลงตามเวลาที่ผ่านไปหลังจากการเกิด mainshock ตามที่แสดงในภาพที่ 3
Data Visualization จึงเป็นเครื่องมือสำคัญในการทำความเข้าใจปรากฏการณ์แผ่นดินไหว การพัฒนาเทคนิคการแสดงผลข้อมูลที่มีประสิทธิภาพจะช่วยให้ประชาชนทั่วไปเข้าใจความเสี่ยงและเตรียมพร้อมรับมือกับแผ่นดินไหวได้ดียิ่งขึ้น ซึ่งในที่สุดจะช่วยลดความสูญเสียต่อชีวิตและทรัพย์สินจากภัยพิบัติทางธรรมชาติชนิดนี้
เอกสารอ้างอิง
- United States Geological Survey (USGS). (2023). Earthquake Hazards Program. https://earthquake.usgs.gov/
- Earthquake Engineering Research Institute (EERI). (2022). Visualizing Earthquake Data: Best Practices and Case Studies.
- Wald, D. J., et al. (2022). “Advances in Seismic Risk Communication Through Data Visualization.” Seismological Research Letters, 93(2), 1021-1035.
- Japanese Meteorological Agency. (2021). The Great East Japan Earthquake: 10 Years of Data Analysis. Tokyo, Japan.
- Allen, R. M., et al. (2023). “Next-Generation Earthquake Early Warning Systems: Visualization and Decision Support.” Bulletin of the Seismological Society of America, 113(4), 1894-1910.
- Woo, G. (2021). “Big Data Analytics for Earthquake Risk Assessment.” Nature Geoscience, 14, 562-568.
- Incorporated Research Institutions for Seismology (IRIS). (2024). Earthquake Visualization Tools. https://www.iris.edu/hq/
- Pacific Earthquake Engineering Research Center (PEER). (2023). Earthquake Data Visualization Guidelines. University of California, Berkeley.
- All earthquakes include most worldwide events magnitude 4.5 and greater
https://earthquake.usgs.gov/earthquakes/map/ - แดชบอร์ดติดตามสถานการณ์การเกิดแผ่นดินไหวในประเทศไทยและประเทศข้างเคียงhttps://envilink.go.th/showcase/earthquakes

Senior Data Management Training and Development Specialist at Big Data Institute (Public Organization), BDI