จากบทความที่แล้วที่ผมได้เล่าถึง COVID-19 กับการเปลี่ยนแปลงไนโตรเจนไดออกไซด์ในไทย ก็มีผู้สนใจสอบถามมาเป็นจำนวนมากในการเข้าถึงข้อมูลมลพิษและภูมิอากาศ จึงเกิดเป็นบทความสอนการใช้ Google Earth Engine นี้ขึ้นมาครับ
Google Earth Engine (GEE) เป็นเว็ปแอปพลิเคชันภูมิสารสนเทศที่มีข้อมูลมากมายจากดาวเทียมสำรวจโลก (Earth Observation Satellites) ดาวเทียมที่เป็นที่รู้จักก็ได้แก่ Landsat, Sentinel, MODIS รวมไปถึงชุดข้อมูลภูมิอากาศ ชุดข้อมูลดิน (ในบางพื้นที่) โดยเราสามารถดูข้อมูลทั้งหมดได้ที่ Link นี้ครับ
ข้อดีที่เห็นชัดๆ อย่างหนึ่งเลยของ GEE ก็คือ โดยปกติแล้วถ้าสมมุติเราต้องการข้อมูลดาวเทียมเพื่อวิเคราะห์อะไรบางอย่าง เราต้อง Download ข้อมูลภาพดาวเทียมมาเก็บเอาไว้ในเครื่องของเราเอง ภาพดาวเทียมแต่ละภาพก็มีขนาดไม่ใช่เล็ก ๆ ไหนจะปัญหาของอินเตอร์ที่โหลด ๆ อยู่ เดี๋ยวก็ค้างบ้าง อินเตอร์เน็ตหลุดบ้าง ปัญหาพวกนี้เป็นปัญหาทั่วไปสำหรับผู้ที่ทำงานกับข้อมูล Remote Sensing ที่ต้องเคยเจอกันอยู่แล้ว GEE ซึ่งมีฐานข้อมูลขนาดมหาศาล (ข้อมูลย้อนหลังมากกว่า 40 ปี) และสามารถวิเคราะห์เชิงพื้นที่ขนาดใหญ่พร้อม ๆ กัน (ทั้งโลก) โดยอาศัยความสามารถของ Google Cloud Computing จึงสามารถใช้แก้โจทย์ในหลาย ๆ ปัญหา อีกทั้งการเข้ามาใช้งานยังไม่มีค่าใช้จ่ายอีกด้วย (อาจเปลี่ยนแปลงได้ในอนาคต)
การใช้งาน GEE สามารถทำได้หลายวิธี เช่น การใช้ Code Editor ซึ่งใช้ JavaScript ในการเรียกใช้ข้อมูล หรือ Explorer ที่สามารถเรียกดูข้อมูลดาวเทียมโดยใช้เพียงการ Point and Click เท่านั้น
โดยในครั้งนี้ผมจะทำการยกตัวอย่างโจทย์ง่าย ๆ โดยเราจะทำการเรียก ข้อมูลอุณหภูมิ (Temperature) และปริมาณน้ำฝน (Precipitation) ของประเทศไทยระหว่างปี 2010 – 2020 แล้วนำมาหาค่าเฉลี่ยของทั้งประเทศเพื่อนำมา Plot เป็น กราฟ Time Series นะครับ เริ่มกันเลย
สมัครใช้งานกันก่อน
ก่อนที่เราจะเริ่มต้นใช้งาน เพียงแค่เรามีบัญชี Gmail และสมัครเข้าใช้งานผ่านทาง Link นี้ เมื่อพร้อมแล้วเราก็สามารถเข้าใช้งาน GEE ผ่าน Python ได้เลย
สำหรับการใช้งาน GEE ผ่าน Python ต้องทำการลงแพ็กเกจ Google Earth Engine Python API ผ่าน PIP ก่อน
pip install earthengine-apiจากนั้น import แพ็กเกจต่าง ๆ เข้ามาใช้งานนะครับ
import ee
from ipygee import *
import folium
import numpy as np
import pandas as pd
import proplot as plot
import matplotlib.pyplot as plt
from pandas.plotting import register_matplotlib_converters
จากนั้นทำการยืนยันตัวตนโดยใช้คำสั่ง ดังนี้
# Trigger the authentication flow.
ee.Authenticate()
# Initialize the library.
ee.Initialize()
ระบบจะทำการขอ verification code ดังรูปที่ 1 ให้ทำการ copy ใส่ลงไป

Thailand Boundary
เราสามารถเรียกใช้ Boundary ของประเทศไทย โดยการเรียกใช้ข้อมูล LSIB 2017: Large Scale International Boundary Polygons, Simplified
thailand = ee.FeatureCollection('USDOS/LSIB_SIMPLE/2017').filterMetadata('country_co', 'equals', 'TH')จากนั้นเราจะใช้ folium ในการเรียกแผนที่ และตั้งกึ่งกลางของแผนที่ไว้ที่ประเทศไทยดังรูปที่ 2
Map = folium.Map(location=[15.0, 100.5], zoom_start=5)
Map.addLayer(thailand)
Map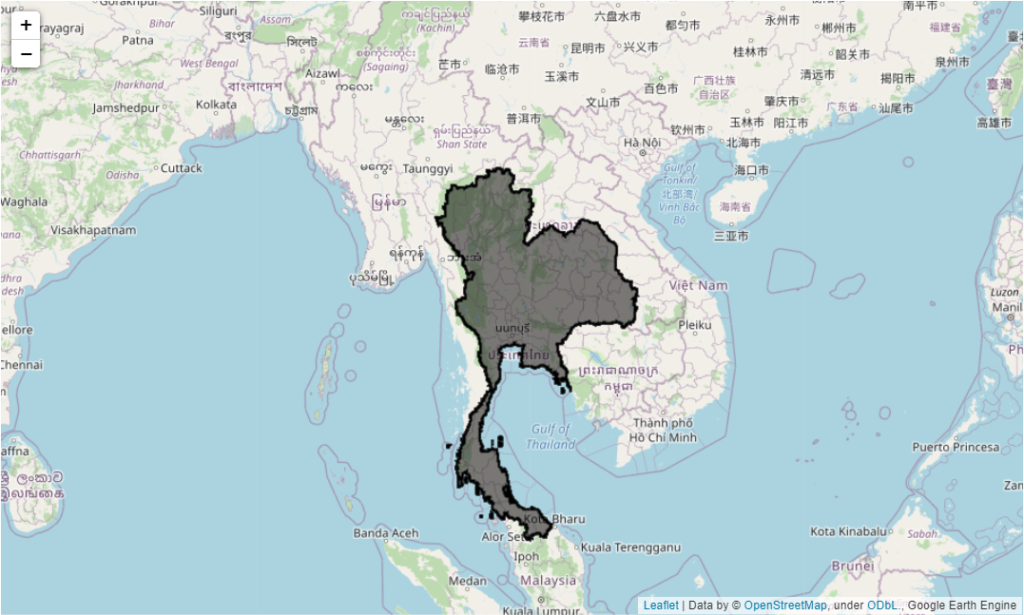
FLDAS (Temperature & Precipitation)
FLDAS : Famine Early Warning Systems Network (FEWS NET) Land Data Assimilation System เป็นผลิตภัณฑ์ข้อมูลที่จัดทำโดย NASA Land Information System ที่สร้างขึ้นจากการใช้แบบจำลองสมดุลน้ำของพืช (crop water balance model) จาก FEWS NET ปริมาณน้ำฝนรายวันจาก NOAA Climate Prediction Center และ CHIRPS ซึ่งเป็นชุดข้อมูลปริมาณน้ำฝนเสมือนทั่วโลก โดยข้อมูล FLDAS ก็สามารถเรียกใช้จาก GEE เช่นเดียวกัน
เราจะทำการเรียกข้อมูล FLDAS ขึ้นมาและ Filter ข้อมูลระหว่างปี 2010 – 2020
# FLDAS Data
FLDAS = ee.ImageCollection('NASA/FLDAS/NOAH01/C/GL/M/V001')
FLDAS = FLDAS.filter(ee.Filter.date('2010-01-01', '2020-06-01'))
สำหรับข้อมูล FLDAS มีข้อมูลหลาย Bands โดยสามารถเข้าไปดูรายละเอียดได้ที่ Link โดยข้อมูลที่เราสนใจจะเป็น Band ที่ชื่อ RadT_tavg (Surface radiative temperature (K)) และ Rainf_f_tavg (Total precipitation rate (kg m-2 s-1)) โดยทำการเรียกดังนี้
# FLDAS Surface radiative temperature
Temp = FLDAS.select('RadT_tavg')
# FLDAS Total precipitation rate
Prec = FLDAS.select('Rainf_f_tavg'
Unit Conversion
เนื่องจากข้อมูลที่เรียกออกมาจะอยู่ในหน่วย Kelvin (K) จึงต้องทำการสร้างฟังก์ชั่นแปลงหน่วย Kelvin (K) เป็น Celsius (°C)
# Function to Convert Kelvin to celsius
def K_to_C(image):
    return image.subtract(273.15).copyProperties(image, ['system:time_start'])
# mapping function to Convert Kelvin to Celsius
Temp_C = Temp.map(K_to_C)
## Note C = K - 273.15เช่นเดียวกันทำการสร้างฟังก์ชั่นแปลงหน่วย kg/m2/s เป็น mm/day
# Function to Convert kg/m2/s to mm/day
def IPCC_to_mmday(image):
    return image.multiply(86400).copyProperties(image, ['system:time_start'])
# mapping function to Convert Kelvin to Celsius
Prec_mm = Prec.map(IPCC_to_mmday)
## Note 1 kg/m2/s = 86400 mm/day (86400 = 24 x 60 x 60 ( total no. of seconds in a day))
Making the Map
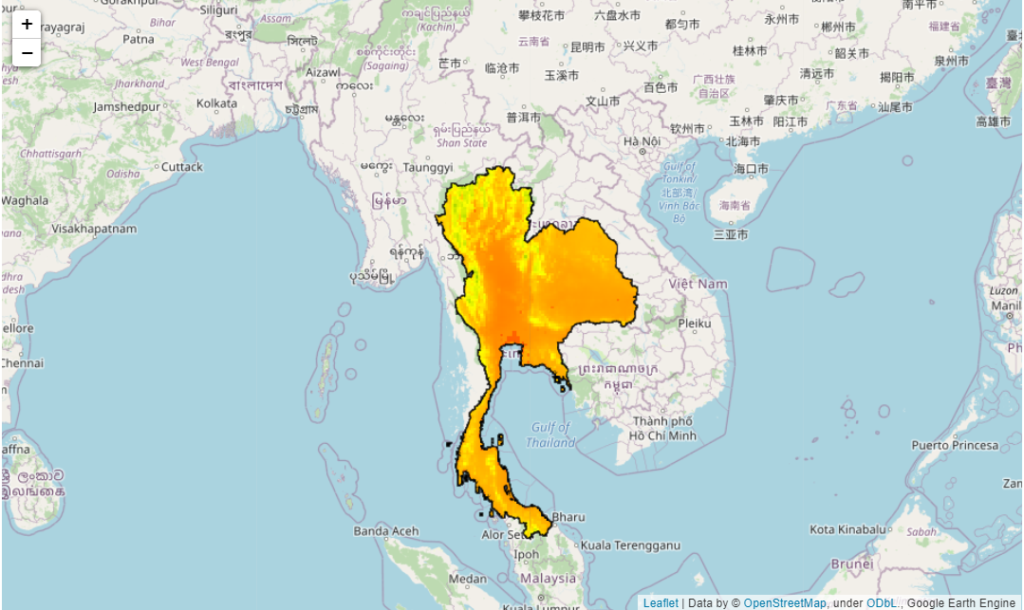
จากนั้นทำสร้างแผนที่ โดยใช้ค่าเฉลี่ย (Mean) ของข้อมูลอุณหภูมิและปริมาณน้ำฝนเฉลี่ยรายวัน ดังรูปที่ 3 และ 4
# mean Surface radiative temperature in Thailand
Map.addLayer(Temp_C.mean().clip(thailand),
                  vis_params={'min': 10,
                              'max': 35,
                             'palette': ['green', 'yellow','red']})
Map
# mean Total precipitation rate in Thailand
Map.addLayer(Prec_mm.mean().clip(thailand),
                  vis_params={'min': 0,
                              'max': 10,
                              'palette': ['red', 'blue']})
Map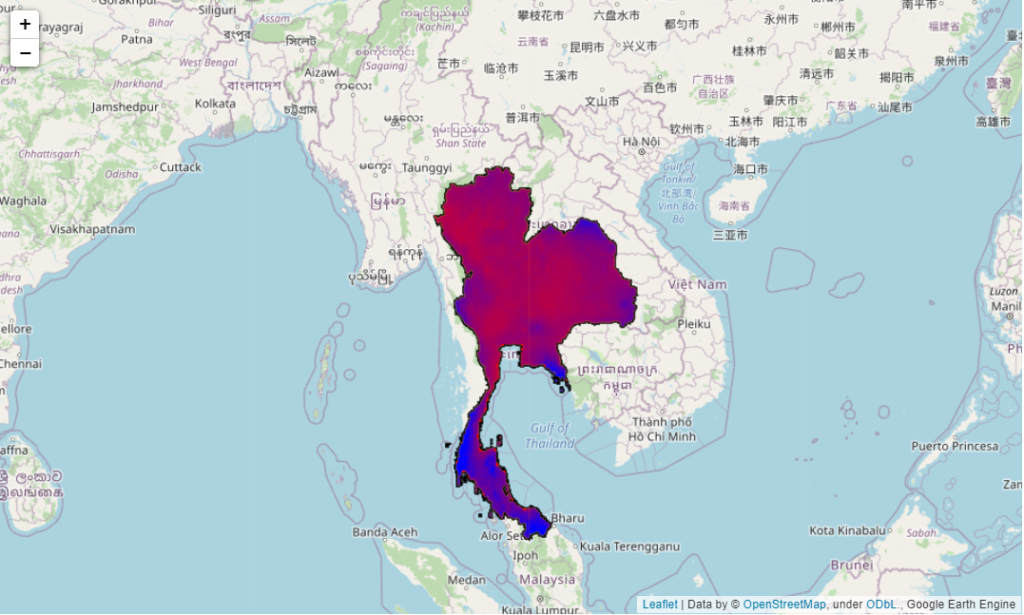
Making Time series chart
หากเราได้ทำการติดตั้งแพ็กเกจ ipygee เราจะสามารถใช้ความสามารถของ GEE บน Python ได้
ตัวอย่าง Code เพื่อเรียกใช้สร้าง Time series chart ของข้อมูลอุณหภูมิ และปริมาณน้ำฝน ดังรูปที่ 5 และ 6
# Thailand Surface radiative temperature time series
TH_Temp_C = chart.Image.series(**{'imageCollection': Temp_C,
                                   'region': thailand,
                                   'reducer': ee.Reducer.mean(),
                                   'scale': 1000,
                                   'xProperty': 'system:time_start'})
TH_Temp_C.renderWidget(width='50%')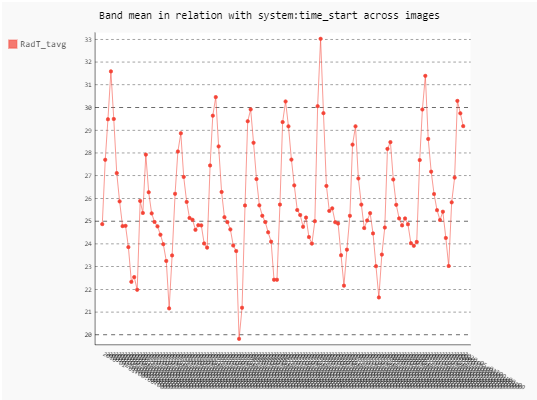
# Thailand Total precipitation rate time series
TH_Prec_mm = chart.Image.series(**{'imageCollection': Prec_mm,
                                   'region': thailand,
                                   'reducer': ee.Reducer.mean(),
                                   'scale': 1000,
                                   'xProperty': 'system:time_start'})
TH_Prec_mm.renderWidget(width='50%')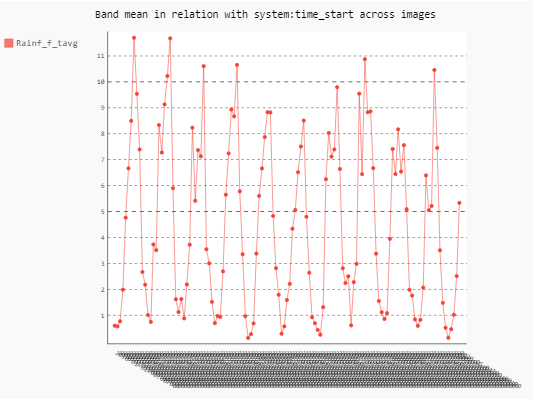
แต่ทั้งนี้เราอาจจะไม่ถูกใจรูปแบบของ chart ที่ GEE แสดงผลเอาไว้ ข่าวดีก็คือเราสามารถทำการแปลงเป็น Dataframe แล้วใช้แพ็กเกจต่าง ๆ ของ Python ในการสร้าง chart ได้
โดยก่อนอื่นเราต้องหาค่าเฉลี่ยรายเดือนของข้อมูลอุณหภูมิ และปริมาณน้ำฝน
# monthly averaging
TH_Temp_C_monthly = TH_Temp_C.dataframe.groupby(pd.Grouper(freq="M")).mean()
TH_Prec_mm_monthly = TH_Prec_mm.dataframe.groupby(pd.Grouper(freq="M")).mean()
จากนั้นเราจะใช้แพ็กเกจ Matplotlib ในการสร้าง Time series chart เปรียบเทียบระหว่างข้อมูลอุณหภูมิ และปริมาณน้ำฝนดังแสดงในรูปที่ 7
# time index
time = TH_Temp_C_monthly.index
# plot
fig, ax1 = plt.subplots(figsize=(7, 3))
ax2 = ax1.twinx()
# Temperature
ax1.plot(time, TH_Temp_C_monthly, label='Temperature (°C)',
         color='salmon', marker='+')
# Precipitation
ax2.plot(time, TH_Prec_mm_monthly, label='Precipitation rate (mm/day)',
         color='steelblue', marker='o')
ax1.set_xlabel('Time')
ax1.set_ylabel('Temperature (°C)')
ax2.set_ylabel('Precipitation rate (mm/day)')
plt.legend()
plt.tight_layout()
plt.show()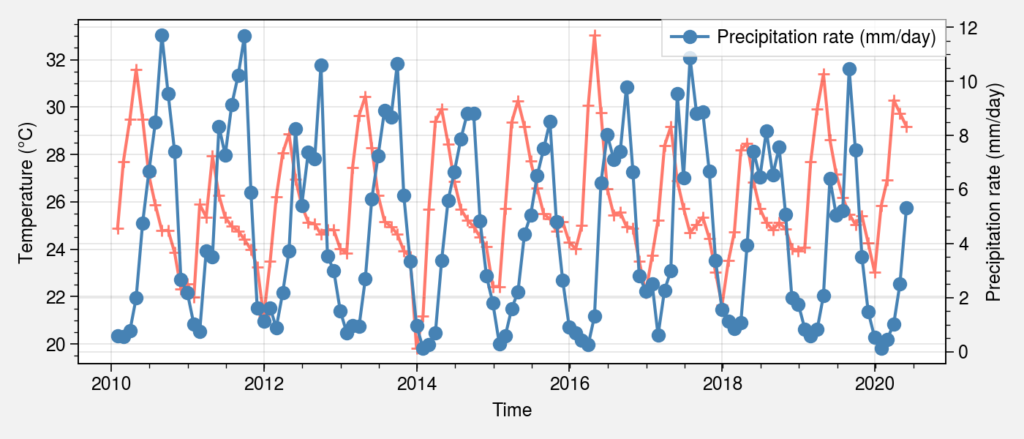
ก็จบไปแล้วสำหรับตัวอย่างการใช้งาน GEE ผ่าน Python ก็หวังเป็นอย่างยิ่งว่าจะเป็นประโยชน์แก่ทุก ๆ ท่านและโอกาสหน้าอาจจะหาโจทย์อื่น ๆ ที่เกี่ยวกับ GEE มาให้ศึกษากันอีกนะครับ