
สำหรับเทคนิคใน Data Science ที่จะมาใช้ในการแก้ปัญหาต่าง ๆ โดยอาศัยข้อมูลนั้นมีหลากหลายวิธี และในบทความนี้จะพูดถึงวิธีการใช้เทคนิค machine learning ในการแบ่งกลุ่มข้อมูล หรือ clustering algorithm ซึ่งเชื่อว่าโมเดลหลาย ๆ คนน่าจะนึกถึงเป็นอันดับแรกก็คือ k-means เพราะด้วยความเรียบง่ายของโมเดล และประสิทธิภาพของการแบ่งกลุ่มที่อยู่ในเกณฑ์ที่ยอมรับได้ k-means จึงเป็นที่นิยมและมักจะถูกเรียกใช้งานอยู่บ่อยครั้ง
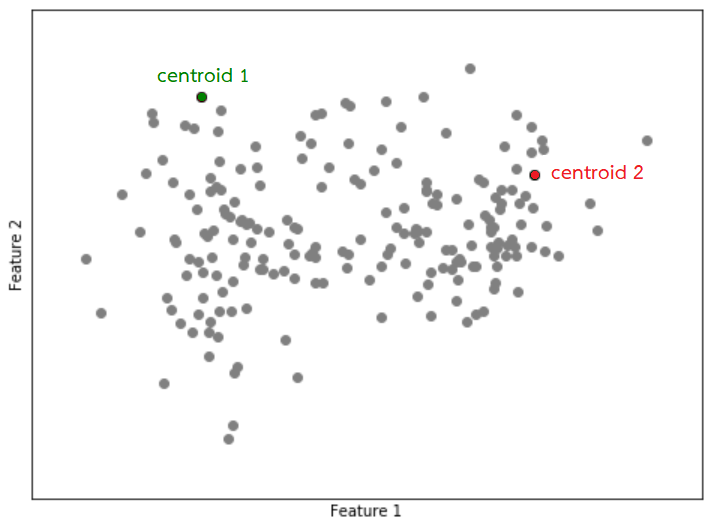
โดยทั่วไปแล้ว k-means มีวิธีการทำงานโดยเริ่มจากการกำหนดจุดศูนย์กลางของกลุ่ม (centroid) มาจำนวน  จุดโดยที่ คือจำนวนกลุ่มที่คาดว่าจะได้จากการแบ่งกลุ่ม จากนั้นคำนวณระยะห่างระหว่างข้อมูลในแต่ละแถวกับ centroid เพื่อใช้ในการจัดกลุ่มข้อมูล โดยระยะห่างนั้นสามารถคำนวณโดยใช้ Euclidean distance
![\[d(\mathbf{x},\mathbf{y}) = \sqrt{\sum_{i=1}^{n}{(x_i - y_i)^2}}\]](https://bdi.or.th/wp-content/ql-cache/quicklatex.com-81c8ba3841e4529dd57f6a495cb3705d_l3.svg "Rendered by QuickLaTeX.com")
โดยที่  และ
และ  เป็นข้อมูลแต่ละแถวที่มีความยาว
  หรือมี ค่า ซึ่งสามารถเข้าถึงแต่ละค่าได้จาก index
  ตัวอย่างเช่น การคำนวณ Euclidean distance สำหรับข้อมูลที่มีความยาว
  ของ
ของ ![\mathbf{x}=[-1,3]](https://bdi.or.th/wp-content/ql-cache/quicklatex.com-14da43d9451820ffbc0c77f9ae9ffd9f_l3.svg "Rendered by QuickLaTeX.com") และ
และ ![\mathbf{y}=[2,7]](https://bdi.or.th/wp-content/ql-cache/quicklatex.com-fc4db3d2c81218dc6625bb6b09d5a553_l3.svg "Rendered by QuickLaTeX.com") ทำได้ดังนี้
ทำได้ดังนี้

เมื่อจัดกลุ่มครบทุกแถวข้อมูลแล้วจะมีการปรับตำแหน่งของ centroid ในแต่ละกลุ่มใหม่ และจะทำวนซ้ำไปเรื่อย ๆ จนกว่าจะตรงตามเงื่อนไขในการหยุดการทำงาน ซึ่งสามารถสรุปเป็นขั้นตอนได้ดังนี้
1. สุ่มข้อมูลมา records เพื่อใช้เป็น centroid (ในกรณีนี้  )
)
2. คำนวณระยะห่างระหว่างข้อมูลแต่ละแถวเทียบกับ centroid ที่มีอยู่ จุด
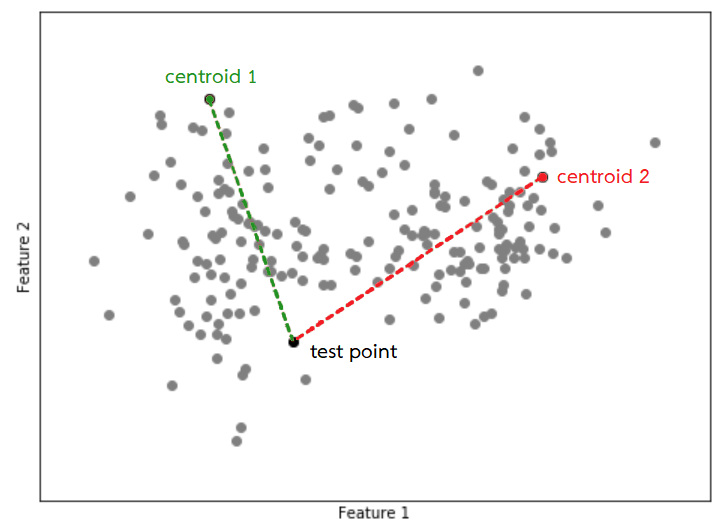
3. จัดกลุ่มจุดข้อมูลให้ไปอยู่กลุ่มเดียวกับ centroid ที่อยู่ใกล้ที่สุด
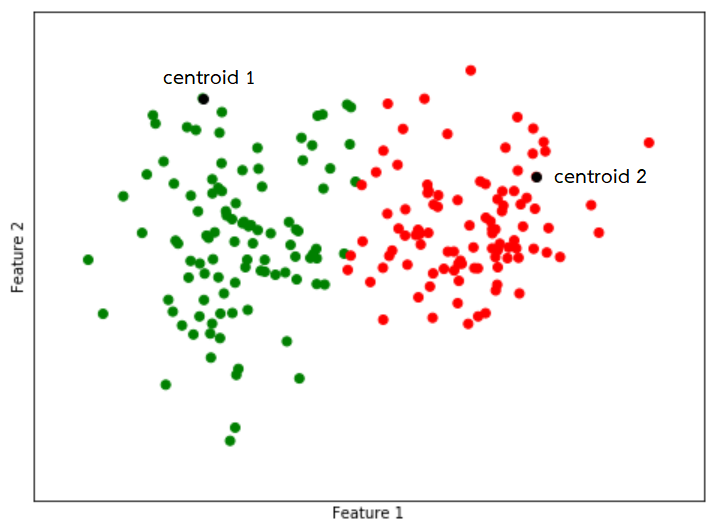
4. ปรับตำแหน่งของ centroid ในแต่ละกลุ่มไปเป็นค่าเฉลี่ยของข้อมูลทั้งหมดที่อยู่ที่ในกลุ่มนั้น
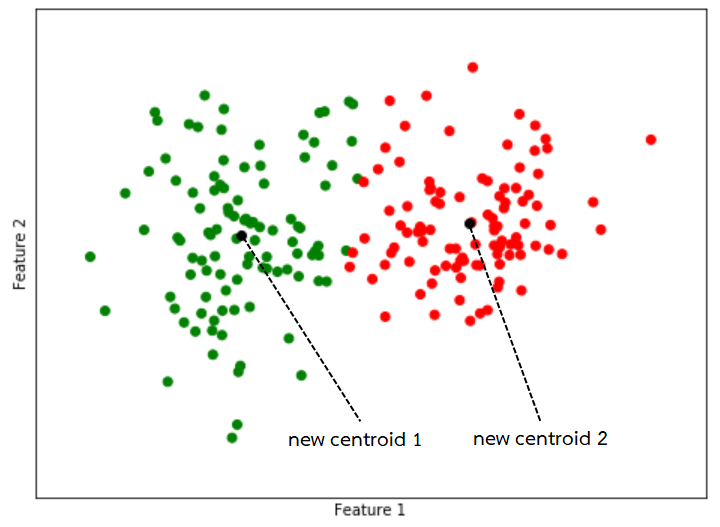
5. ทำขั้นตอนที่ 2 ถึง 4 จนกว่าจะถึงเกณฑ์ที่ใช้ในการหยุด
แม้ว่าจะเป็นโมเดลที่ได้รับความนิยมมากหรือมีความเรียบง่ายแค่ไหนก็ตาม k-means มีข้อจำกัดอย่างหนึ่งคือสามารถใช้ในการแบ่งกลุ่มข้อมูลที่เป็นตัวเลข (numerical feature) ได้เท่านั้น เลยทำให้เกิดคำถามที่ว่า “จะต้องทำอย่างไรหากต้องการแบ่งกลุ่มข้อมูลที่ไม่ใช่ตัวเลข หรือข้อมูลที่เป็นหมวดหมู่ (categorical feature)”
เนื่องจากว่าในวิธีการทำงานของ k-means มีการคำนวณระยะห่าง ซึ่งถ้าข้อมูลไม่ได้มีแค่ตัวเลข แต่มีตัวอักษรหรือข้อความรวมอยู่ด้วย จะไม่สามารถทำในขั้นตอนที่ 2 และ 4 ได้ เพราะระยะห่างและค่าเฉลี่ยระหว่างตัวอักษรหรือข้อความนั้นไม่สามารถถูกคำนวณได้ด้วยสูตรแบบเดียวกันกับที่ใช้ในการคำนวณข้อมูลที่เป็นตัวเลข
อย่างไรก็ตาม Z. Huang1 ได้เอาชนะข้อจำกัดนี้ โดยเปลี่ยนการวัดระยะห่างสำหรับ categorical feature ใหม่ เป็นการวัดความคล้ายคลึงระหว่างกันแทน ซึ่งกำหนดว่าหากเป็นข้อมูลที่มีค่าเดียวกันจะให้ค่าเป็น 0 และถ้าเป็นค่าที่แตกต่างกันจะให้ค่าเป็น 1 และเรียกปริมาณนี้ว่า dissimilarity measure ( )
)
![\[\delta(\mathbf{x},\mathbf{y})=\begin{cases}1 & \text{if } \mathbf{x}\ne\mathbf{y}\0 & \text{if } \mathbf{x}=\mathbf{y}\end{cases}\]](https://bdi.or.th/wp-content/ql-cache/quicklatex.com-232c65acb23f8406621a4be411685653_l3.svg "Rendered by QuickLaTeX.com")
โดยที่ และ เป็นตัวอักษรหรือข้อความใด ๆ ยกตัวอย่างเช่น  เนื่องจาก ‘GBDi’ นั้นแตกต่างจาก ‘Big data’ และ
  เพราะเป็นคำหรือข้อความเดียวกัน
ด้วยเหตุนี้จึงทำให้ปริมาณที่ใช้วัด “ระยะห่าง” ระหว่างข้อมูลแต่ละตัวกับจุด centroid ในแต่ละกลุ่มจะถูกเปลี่ยนแปลงตามไปด้วย โดยจะกลายเป็นส่วนผสมระหว่างระยะห่างจริง ๆ ที่เคยใช้ใน k-means หรือก็คือ Euclidean distance เพื่อคำนวณสำหรับ numerical feature และระยะหรือความคล้ายคลึงที่สร้างขึ้นใหม่ หรือก็คือ dissimilarity measure เพื่อคำนวณสำหรับ categorical feature ซึ่งสามารถเขียนเป็นสมการได้เป็นดังนี้
![\[d(\mathbf{x},\mathbf{y}) = \sum_{i \in{n_r}}{(x_i - y_i)^2} + \gamma \sum_{i \in{n_c}}{\delta(x_i,y_i)}\]](https://bdi.or.th/wp-content/ql-cache/quicklatex.com-dc539874f411a4b6996abbc8cf30dab1_l3.svg "Rendered by QuickLaTeX.com")
โดยที่ และ เป็นข้อมูลแต่ละแถวโดยมี numerical feature อยู่  คอลัมน์ และมี categorical feature อยู่
  คอลัมน์ และ
  คือ weight ของ dissimilarity measure โดยตัวอย่างการคำนวณจะสมมุติให้
 ![\mathbf{x} = [-1, 3, \text{`GBDi'}, \text{`COVID'}]](https://bdi.or.th/wp-content/ql-cache/quicklatex.com-c8dadf93058483114d0b27f7eaf8abbf_l3.svg "Rendered by QuickLaTeX.com") และ
และ ![\mathbf{y} = [2, 7, \text{`Big data'}, \text{`COVID'}]](https://bdi.or.th/wp-content/ql-cache/quicklatex.com-29ff30a5c5033e2eb23a3a4c70a6efd3_l3.svg "Rendered by QuickLaTeX.com") โดยให้
โดยให้  ทำให้ได้ว่าระยะห่างระหว่าง 2 ข้อมูลนี้มีค่าเท่ากับ 6.5 ซึ่งมีวิธีการคำนวณ ดังนี้
![\begin{align*} d(\mathbf{x},\mathbf{y}) &= \sum_{i \in{n_r}}{(x_i - y_i)^2} + \gamma \sum_{i \in{n_c}}{\delta(x_i,y_i)} \\&= [(-1-2)^2+(3-7)^2 ]+1.5[\delta(\text{`GBDi'}, \text{`Big data'})+\delta(\text{`COVID'},\text{`COVID'})] \\&= [(-3)^2+(-4)^2 ]+1.5(1+0) \\&= 5+1.5 = 6.5 \end{align*}](https://bdi.or.th/wp-content/ql-cache/quicklatex.com-6ec4342610e697645ef5df3c0338bd73_l3.svg "Rendered by QuickLaTeX.com")
เมื่อทำการแทนที่ระยะห่างใน k-means ด้วยปริมาณดังกล่าวก็ทำให้วิธีการในขั้นตอนที่ 2 กลับมาทำงานได้อีกครั้ง สำหรับขั้นตอนที่ 4 ที่มีการปรับตำแหน่งของ centroid ในแต่ละกลุ่มจะถูกแยกคิด ถ้าเป็น numerical feature ยังคงใช้ค่าเฉลี่ยของ record เหมือนเดิม แต่ถ้าเป็น categorical feature จะเปลี่ยนไปใช้ค่าฐานนิยม (mode) ของ record ทั้งหมดที่อยู่ในกลุ่มนั้นแทน โดยวิธีการที่ถูกพัฒนาขึ้นมาใหม่นี้มีชื่อเรียกว่า k-prototypes
แท้จริงแล้ว k-prototypes คืออีกรูปแบบหนึ่งของ k-means ที่ถูกพัฒนาให้รองรับ categorical feature ซึ่งถ้าข้อมูลที่ใช้เป็น numerical feature ทั้งหมด k-prototypes จะถูกเรียกว่า k-means และถ้าข้อมูลที่ใช้เป็น categorical feature ทั้งหมด k-prototypes จะถูกเรียกว่า k-modes
สรุป
k-prototypes ได้ถือกำเนิดขึ้นเพื่อรองรับการแบ่งกลุ่มข้อมูลที่ไม่ใช่ตัวเลข โดยการปรับปรุงวิธีการคำนวณความแตกต่างระหว่างข้อมูลใน k-means จากการที่วัดเพียงระยะห่างซึ่งสามารถคำนวณได้เฉพาะ numerical feature ก็ได้เพิ่มการวัดความคล้ายคลึงระหว่างข้อมูลสำหรับ categorical feature
หาก k-prototypes ถูกใช้ไปกับ numerical feature ทั้งหมด โมเดลนี้อาจถูกเรียกว่า k-means ได้ และถ้าถูกใช้ไปกับ categorical feature โมเดลนี้อาจถูกเรียกว่า k-modes
การใช้งาน k-modes และ k-prototypes ใน python
สามารถเรียกใช้งาน k-modes และ k-prototypes ได้ด้วย package kmodes โดยมี parameter ที่สำคัญ ดังนี้
n_clustersคือจำนวนกลุ่มที่คาดว่าจะได้จากการแบ่งกลุ่มmax_iterคือจำนวนรอบสูงสุดในการรันโมเดลinitคือวิธีการในการกำหนด centroid ในตอนแรก
3.1‘Huang’คือการเลือก k records ที่ปรากฏมากที่สุดในข้อมูลทั้งหมด2
3.2‘Cao’คือการเลือก record ที่มีความหนาแน่นมากที่สุด (มี record อื่น ๆ อยู่ใกล้มาก) มาเป็น centroid กลุ่มแรก และสำหรับการกำหนด centroid กลุ่มอื่น ๆ จะพิจารณาจากความหนาแน่นและความแตกต่างของ centroid ที่ถูกกำหนดไว้แล้ว3n_initคือจำนวนครั้งในการรันโมเดลด้วยรูปแบบ centroid ที่แตกต่างกัน
สำหรับ k-prototypes จะมี parameter ที่เพิ่มเข้ามาอีกหนึ่งตัวในตอนเทรนโมเดล คือ categorical ซึ่งต้องใส่ค่าเป็น list ของตำแหน่งคอลัมน์ของ categorical feature โดยมีรูปแบบการใช้งาน ดังนี้
from kmodes.kmodes import KModes
from kmodes.kprototypes import KPrototypes

# k-modes algorithm
clusterer = KModes(n_clusters=k, init='Cao', n_init=n)
labels = clusterer.fit_predict(X)
cost = clusterer.cost_
centroids = clusterer.cluster_centroids_

# k-prototypes algorithm
clusterer = KPrototypes(n_clusters=k, init='Cao', n_init=n)
labels = clusterer.fit_predict(X, categorical=list_of_categorical_features)
cost = clusterer.cost_
centroids = clusterer.cluster_centroids_
ยกตัวอย่างเช่น ต้องการแบ่งกลุ่มโปเกม่อนที่มีข้อมูลห้าแถวแรก ดังนี้
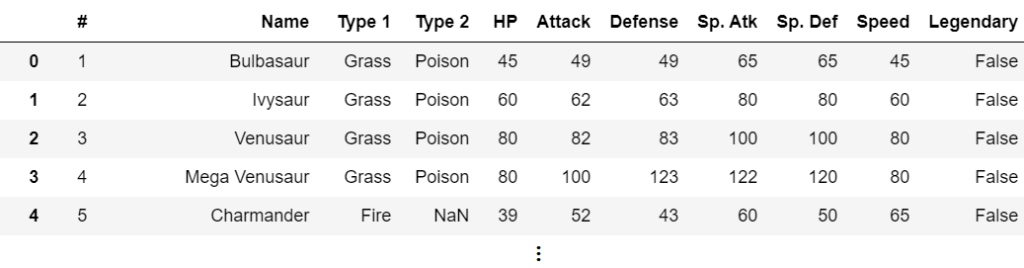
ในการแบ่งกลุ่มข้อมูลจะตัด 2 คอลัมน์แรกทิ้งไปก่อน ให้เหลือไว้เฉพาะคอลัมน์ที่แสดงถึงลักษณะของโปเกม่อนแต่ละตัว พบว่ามีใน categorical feature อยู่ 3 คอลัมน์คือ Type 1, Type 2 และ Legendary และนอกนั้นจะเป็น numerical feature ทำให้ต้องใช้ k-prototypes ในการแบ่งกลุ่มข้อมูลนี้ และจากการแบ่งกลุ่มพบว่าจำนวนกลุ่มควรเป็น 5 กลุ่ม ซึ่งจะได้ centroids ในแต่ละกลุ่ม ดังนี้

และสามารถจัดกลุ่มโปเกม่อนแต่ละตัวได้ว่า Bulbasaur จะอยู่กลุ่มที่ 3 และเป็นกลุ่มเดียวกับ Charmander ซึ่งเมื่อดู centroid แล้วน่าจะเป็นกลุ่มโปเกมอนอ่อนแอ เป็นต้น

สำหรับการประยุกต์ใช้อื่น ๆ นั้น เทคนิคนี้สามารถใช้ได้กับปัญหาหลายอย่าง แต่ในสถานการณ์ที่มีการระบาดของ COVID-19 ทางสถาบันส่งเสริมการวิเคราะห์และบริหารข้อมูลขนาดใหญ่ภาครัฐ (GBDi) ก็ได้มีการนำการแบ่งกลุ่มลักษณะนี้ไปใช้เพื่อทำความเข้าใจพฤติกรรมของประชาชนต่อโรคระบาดได้เหมือนกัน ซึ่งสามารถอ่านเพิ่มเติมได้ที่ การวิเคราะห์พฤติกรรมของคนไทยในการรับมือ COVID-19 ด้วย Data Science ครับ
ที่มา:
- Huang, Z.: Clustering large data sets with mixed numerical and categorical values, Proceedings of the First Pacific Asia Knowledge Discovery and Data Mining Conference, Singapore, pp. 21-34, 1997.
- Huang, Z.: Extensions to the k-modes algorithm for clustering large data sets with categorical values, Data Mining and Knowledge Discovery 2(3), pp. 283-304, 1998.
- Cao, F., Liang, J, Bai, L.: A new initialization method for categorical data clustering, Expert Systems with Applications 36(7), pp. 10223-10228., 2009.
เนื้อหาโดย ภคภูมิ สารพัฒน์
ปรับปรุงและแก้ไขโดย นนทวิทย์ ชีวเรืองโรจน์ และ ปพจน์ ธรรมเจริญพร


Former-Editor-in-Chief at BigData.go.th and Senior Data Scientist at Government Big Data Institute (GBDi )