การสร้างแดชบอร์ด (dashboard) เพื่อแสดงข้อมูลในรูปแบบที่เข้าใจง่ายและมีประสิทธิภาพถือเป็นสิ่งสำคัญในยุคดิจิทัลปัจจุบัน ไม่ว่าจะเป็นการใช้งานในธุรกิจ การศึกษา หรือการวิเคราะห์ข้อมูล ในปัจจุบันมีเครื่องมือมากมายที่สามารถสร้างแดชบอร์ดได้อย่างรวดเร็ว เช่น Tableau และ Power BI ซึ่งเป็นโปรแกรมสำเร็จรูปที่มีเครื่องมือและฟังก์ชันการทำงานที่หลากหลาย ช่วยให้ผู้ใช้งานสามารถสร้าง แดชบอร์ด ได้โดยไม่ต้องมีทักษะการเขียนโปรแกรม
อย่างไรก็ตามการสร้างแดชบอร์ดบนเว็บไซต์โดยใช้ JavaScript libraries เช่น Chart.js ใน Next.js ถือเป็นทางเลือกที่มีความยืดหยุ่นและสามารถปรับแต่งได้อย่างเต็มที่ ซึ่งเป็นการเปิดโอกาสให้ผู้พัฒนาสามารถสร้างแดชบอร์ด ที่ตอบโจทย์เฉพาะของตนเองได้มากยิ่งขึ้น
Chart.js คืออะไร
Chart.js เป็น JavaScript library ที่ช่วยให้นักพัฒนาสามารถสร้างกราฟและแผนภูมิในเว็บไซต์ได้อย่างง่ายดาย โดยไม่จำเป็นต้องมีความรู้ด้านการเขียนโค้ดที่ซับซ้อน นอกจากนี้ยังมีคุณสมบัติที่ยืดหยุ่นและปรับแต่งได้ตามความต้องการของผู้ใช้งาน Chart.js รอบรับการสร้างกราฟหลากหลายประเภท เช่น กราฟแท่ง กราฟเส้น กราฟวงกลม กราฟเรดาร์เป็นต้น อีกทั้ง Chart.js ยังมีขนาดเล็กและง่ายต่อการใช้งาน ทำให้เป็นตัวเลือกที่ดีสำหรับการสร้างแดชบอร์ดที่มีประสิทธิภาพ
การใช้งาน Chart.js
Chart.js สามารถติดตั้งได้ผ่าน Node Package Manager (npm) หรือ Content Delivery Network (CDN) ก็ได้ หลังจากติดตั้งเรียบร้อยแล้ว การสร้างกราฟจะสร้างผ่านตัวแปรและนำตัวแปรนั้นไปแสดงผลบนเว็บไซต์ในตำแหน่งที่ต้องการ
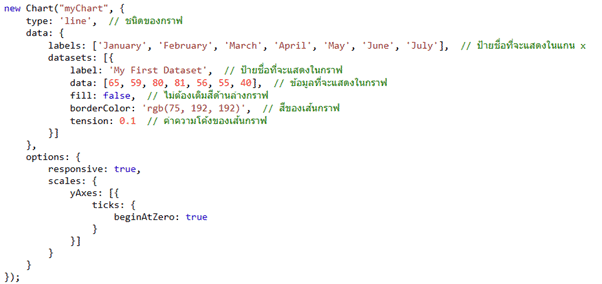
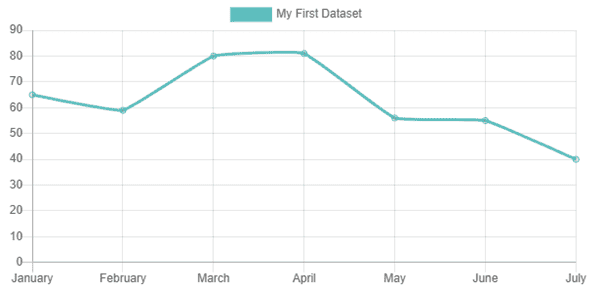
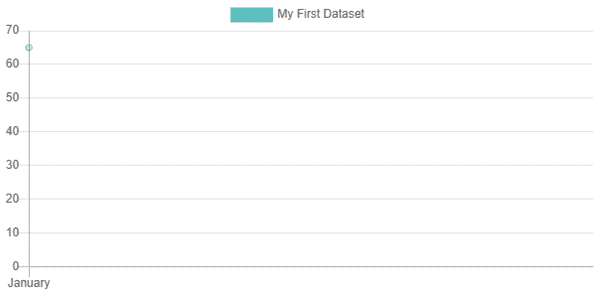
ด้านบนเป็นการแสดงตัวอย่างการสร้างกราฟเส้น โดยหลัก ๆ แล้วการสร้างกราฟจะถูกแบ่งเป็น 2 ส่วนคือ ส่วนของข้อมูลและส่วนขององค์ประกอบอื่น ๆ ของกราฟ (option) ในส่วนของข้อมูลนั้นจะเป็นชื่อแกน ตัวเลขที่แสดงในกราฟ สีของกราฟเป็นต้น จากที่แสดงในตัวอย่างค่าของแกนนอน (x) จะเป็นชื่อเดือนตั้งแต่เดือน มกราคม ถึง กรกฎาคม จากตัวแปรที่ชื่อ “labels” ชื่อชุดข้อมูล จำนวนและองค์ประกอบต่าง ๆ ของเส้นกราฟสำหรับข้อมูลนั้นจะอยู่ในตัวแปรที่ชื่อว่า “datasets” ทั้งนี้ถ้าหากมีชุดข้อมูลมากกว่า 1 ชุดก็สามารถเพิ่มในส่วนนี้ได้เลย
ในด้านองค์ประกอบอื่น ๆ ก็จะเกี่ยวกับการปรับแต่งค่าเริ่มต้นและสิ้นสุดของแกน การแสดงคำแนะนําเครื่องมือ (tooltip) การแสดงตัวเลขข้อมูล (data label) รวมถึงฟังก์ชัน (function) ในการกระทำ (Action) ต่าง ๆ ดังนั้นเมื่อนำกราฟหลาย ๆ อันมารวมกันก็จะสามารถประกอบกันเป็นแดชบอร์ดได้
ฟังก์ชันที่สำคัญอีกอย่างของแดชบอร์ดนั้นคือความสามารถในการตอบโต้ (interaction) เมื่อผู้ใช้งานคลิก (click) ที่กราฟ สิ่งที่จะเกิดขึ้นมักจะเป็นการกรองข้อมูล (filter) ให้เหลือข้อมูลในส่วนที่สนใจเท่านั้น ใน chart.js ก็สามารถทำได้เหมือนกันเพียงแค่เพิ่มฟังก์ชันในการกรองข้อมูลหลังจากที่กราฟถูกคลิกตามตัวอย่างดังนี้
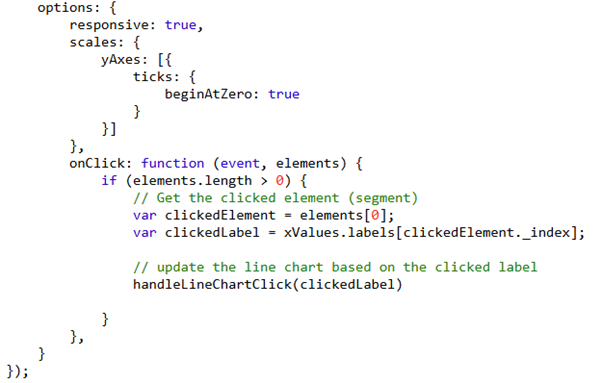
จากตัวอย่างจะเห็นได้ว่าฟังก์ชัน onClick จะถูกเพิ่มลงในส่วนประกอบของการสร้างกราฟ จากคำสั่งด้านบนจะเป็นการสกัด label ของกราฟในส่วนที่ถูกคลิกเพื่อส่งต่อไปยังฟังก์ชันที่ชื่อ handleLineChartClick เพื่อทำการกรองข้อมูล เปลี่ยนสีกราฟ เป็นต้น
จากตัวอย่างจะเป็นการกรองข้อมูลให้เหลือเฉพาะข้อมูลที่ถูกเลือกเท่านั้น หากมีหลายกราฟ ข้อมูลในกราฟอื่น ๆ ก็จะถูกกรองไปด้วยเช่นกัน เท่านี้ก็จะทำให้แดชบอร์ดบนเว็บของเรานั้นมีการตอบโต้แล้ว
โดยสรุปแล้วการสร้าง Dashboard นั้นไม่ได้จำกัดอยู่แค่เครื่องมืออย่าง Power BI และ Tableau เท่านั้น แต่ยังสามารถทำได้ผ่านวิธีอื่น ๆ เช่นการใช้ Chart.js ซึ่งเป็น JavaScript library ที่ช่วยในการสร้างกราฟบนเว็บไซต์ ข้อดีของการใช้ Chart.js คือความยืดหยุ่นและการปรับแต่งที่ง่ายดาย ผู้ใช้สามารถออกแบบกราฟให้เข้ากับความต้องการเฉพาะได้ ไม่ว่าจะเป็นการแสดงผลในรูปแบบใด ๆ และยังสามารถทำงานร่วมกับเว็บไซต์หรือแอปพลิเคชันได้อย่างราบรื่น
บทความโดย ทักษ์ดนัย แซ่ลี่
ทบทวนและปรับปรุงโดย อิสระพงศ์ เอกสินชล
เอกสารอ้างอิง


Senior Project Manager & Data Scientist at Big Data Institute (Public Organization), BDI